Oculyze in fermentation wine practice
The article was originally published in DAS DEUTSCHE WEINMAGAZIN.
Yeast cell counts in the course of fermentation
In autumn 2019, various tests with the app-supported microscope from Oculyze were carried out at DLR Mosel, DLR Rheinpfalz and DLR RNH. Dominik Süß, DLR RNH, presents the results of the practical tests here.
The Oculyze is a microscope that, in connection with a smartphone, records images of the examined medium and automatically evaluates them. In cellar management, this enables the yeast cell count to be recorded quickly during fermentation. In addition, a special sample preparation can be used to differentiate between living and dead yeast cells. These two tests are not new; in other words, they have been known for over 100 years. The total number of cells as well as the proportion of dead or dying cells, keyword apoptosis, has repeatedly been the subject of various scientific studies. It has been shown that these two parameters can predict the occurrence of a fermentation disturbance long before its actual effect on the fermentation process.
Checking cell counts using a microscope was previously very time-consuming
Nevertheless, the microscopic examination of fermentation has not found its way into practice. This is mainly due to the previously very complex parameter determination. With the analog examination using a microscope, an enormous amount of time is required for the examination. Hundreds of cells may have to be counted here, the only resources being pen and paper. The invention of the flow cytometer at the end of the 1960s made it possible to automate this process, but the devices are only suitable for laboratory use. The acquisition costs of these devices have fallen sharply in recent years, but they are not worthwhile for laboratories, partly because of the low demand.
Oculyze as a real alternative
The solution from Oculyze can offer a real alternative here. The Oculyze Fermentation Wine (FW) is able to do the manual counting of hundreds of cells quickly and automatically. No expensive laboratory equipment is required for this, the supplied “plastic microscope” with integrated camera in connection with your own smartphone is all that you need. This is made possible by a cloud-based analysis of the microscope images. The enlarged images of the must are transferred to the company’s server via an app and evaluated there in seconds. The speed of the evaluation is only limited by the speed of the internet connection. When using a standard household WiFi network, the evaluation arrives on the smartphone in a few seconds.
The app is shown in Figure 1. Here you can see the screen after a measurement. The total number of cells and the viability of the proportion of living cells are shown in dark red and pink. The budding percentage of the cells is also displayed as a small bud in the total number of cells. The diagram shows the distribution of the cells depending on their size and the recordings made can be seen at the bottom of the display. Figure 2 shows such a recording. The app makes it possible to check the evaluation. The cells with a green background have been recognized as such and counted. The yellow cells were recognized as budding and the purple cells are dead. The fact that some cells were not recognized, especially in the edge area, is not a mistake, but has to do with the counting method. Cells that touch the red area of the ring are not counted, those that touch the white area are counted.
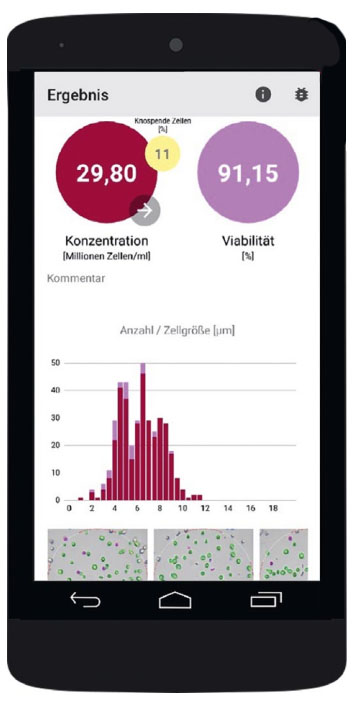
Fig. 1
Screenshot of the Oculyze App
Foto: pixabay/Dominik Süß
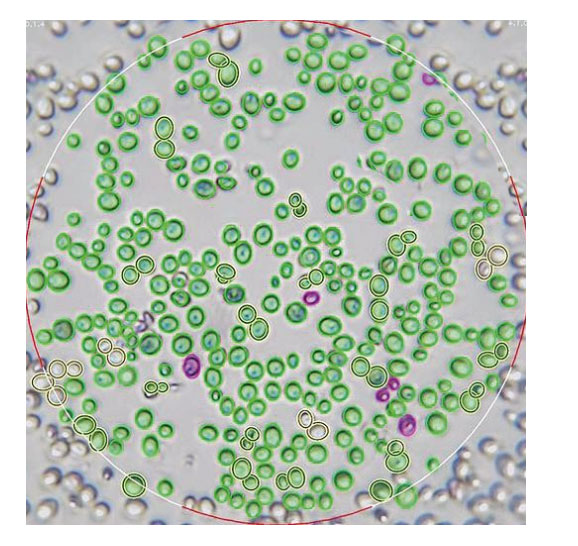
Fig. 2
Yeast cells in an image evaluted by Oculyze Microscope: The green yeast cells were counted, yellow cells were recognized as budding, while the dead yeast cells were marked purple.
Foto: Oculyze / Dominik Süß
Practical tests in autumn 2019
This system was tested for practicality at the DLR RNH in autumn 2019. For this purpose, a Silvaner-must was inoculated with different yeasts in different concentrations and fermented spontaneously. The total number of cells and the proportion of dead cells were determined every other day. In addition, samples from various fermentation stoppages were examined. The Oculyze results were repeatedly checked by manual counting and found to be correct. At the DLR Rheinpfalz, the accuracy of the measurement results was checked on a larger scale and there was also a high level of precision. However, this was only checked for pure yeast, whether the same also applies to spontaneous fermentation, should be the content of this year’s investigations, among other things. Nevertheless, it can be said that the Oculyze is suitable for reliably determining cell counts during fermentation. It is important to mention, however, that the measurement is automated. Using the Oculyze does not generate any additional or better data than when using a classic microscope. The advantage lies solely in the application and the time savings when measuring.
Guide values for practice
The user has to assess the results. This is where the DLR’s experiments come in. With the first experiments in 2019 and their continuation in the coming years, practical guide values, depending on must weight, degree of clarification and other things, are to be developed for the total cell count. The aim is to enable winemakers to independently examine their fermentation and draw appropriate conclusions. In order to make the examination by means of microscopy even more economical, it should also be examined whether there are particularly critical times in the fermentation during which the examination of the total cell count is particularly meaningful.
In 2019, the tests initially aimed at general practicability and initial investigations into the early detection of fermentation blockages. As can be seen in Figure 3, the new parameter total cell count can be integrated very well into existing fermentation curves. The scale of the sugar content in °Oe now also shows the total number of cells in millions of cells. The four fermentation phases can be seen very clearly in Figure 3. In the adaptation phase the total number of cells is very low. In the growth phase, the cells begin to divide and their number increases exponentially until it has reached its maximum in the stationary phase. Towards the end of fermentation, the number of cells decreases again through death and sinking. This fermentation was carried out by a pure yeast (EC1118) and should be considered optimal here.
The reader may have noticed that the percentage of dead cells is not shown. In the course of the investigation it was shown that the percentage of living cells changes only very slightly during fermentation. Because dead cells are known to sink, so the container would have had to be stirred before sampling in order to correctly determine the proportion of dead cells. This is not recommended in practice. The determination of apoptotic, i.e. dying, cells is also less relevant in practice, as intensive sample preparation with several chemicals is necessary.
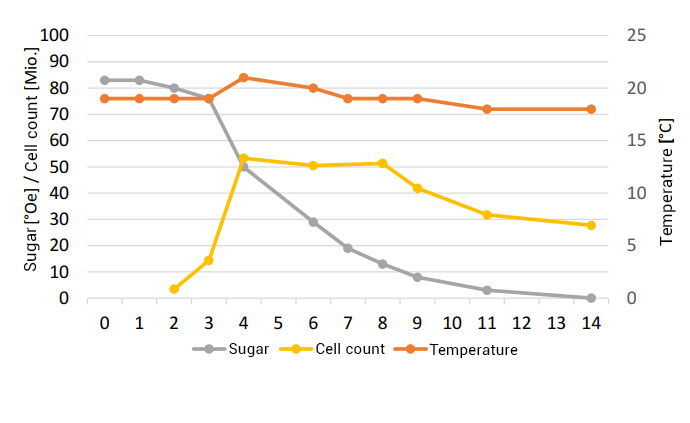
Fig. 3
Oculyze in practice:
Fermentation curve of Silvaner-must with yeast cell counts
Determination of the total number of cells
As a first result, however, it can be stated that, if the method becomes established in practice, the determination and assessment of the total number of cells will be relevant. Figure 4 shows that the determination and evaluation of the total number of cells, especially at the beginning of fermentation, is extremely informative and days ahead of the classic fermentation curve. The same Silver must is shown here, but fermented spontaneously. The difference in temperature in the first few days can be explained by the fact that the must was warmed up until fermentation began in order to support the spontaneous fermentation. Despite the initial help, it is immediately noticeable that the total number of cells does not reach the level of pure yeast fermentation. Even with daily fermentation control, the fermentation disturbance would only have been recognized on the tenth day, based only on the fermentation curve. “If the daily loss of must weight decreases in the range of 30 to 40 ° Oe below 5 ° Oe / day, (…) measures to promote fermentation (…) should be taken”, (KIS 9 2019). The light blue curve shows the total cell count from the fermentation from Figure 3; when comparing the two curves five days beforehand, it becomes apparent that the total cell count is far outside the optimum range. With the help of the total number of cells, it is possible to identify fermentation blockages long before they occur. As soon as the fermentation disturbance shows up in the fermentation curve, it is only possible to react; prevention is no longer possible.
As part of the investigation, a spontaneous fermentation with pure yeast was also inoculated after seven days. It was found that there was no significant increase in the total number of cells. The differences are based solely on the higher performance of the pure yeast. In addition, no yeast nutrients were used during the inoculation. Nevertheless, there is an increased fermentation activity in the inoculated variant.
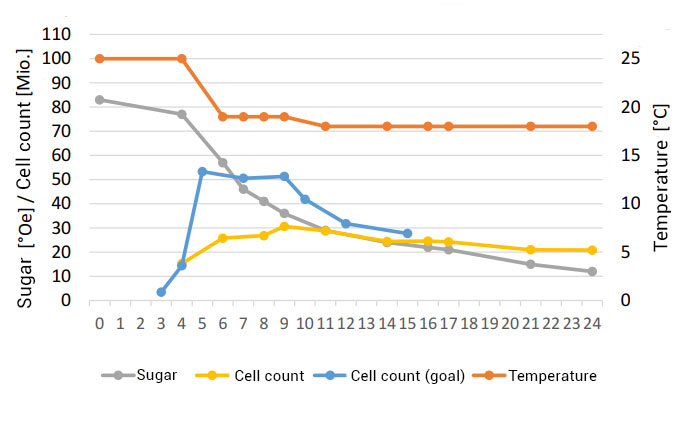
Fig. 4
Oculyze in practice:
Fermentation curve with yeast cell counts of a spontaneously fermented Silvaner-must and yeast cell counts of the pure yeast fermentation
Costs
You can find our pricing details here.
Practical suitability / application
The Oculyze was tested in the test cellar and not in the laboratory in order to make the conditions as practical as possible. The microscopic examination was integrated into the normal fermentation control. A small work area is sufficient to use the Oculyze. All necessary working materials, such as disposable pipettes and microscope slides, are included in the delivery. The authors also recommend two small vessels (approx. 200 ml) – empty and with distilled water – for rinsing and for the leftovers. Under these conditions, it takes about three to five minutes for the measurement including sampling. WLAN is helpful, but not necessary, as the device can also temporarily store the images and only send them afterwards. The power consumption of the microscope is a little critical; the fully charged smartphone can be depleted after an hour of measurements. One potential issue is that the USB interface is occupied by the microscope, so it cannot be charged during the same time. The use of a tablet can help here; these usually have larger batteries, are more convenient and can also be better combined with cellar management programs. After continuous use in the first autumn, it turned out that the Oculyze is robust enough for use in the basement, small splashes of water or the like are not a problem. The plastic microscope slides should be used with caution, but they can easily withstand a fall from the table and can also be used easily scratched. It is still advisable to have a spare slide on hand (two included).
Conclusion
With the Oculyze, the winemaker is given an effective, practical and, above all, fast instrument to microscopically monitor his fermentation. When it comes to the microbiological interpretation of the results, the user still has to fall back on his specialist knowledge; a sound training is a prerequisite here. Both Oculyze itself and the DLR in Rhineland-Palatinate are already working on providing the user with help in the form of situation-related target cell numbers. As a result of climate change, the conditions during fermentation – sugar levels, drought stress and nutrient supply – are becoming more demanding for the yeasts. Although there is no increase in fermentation blockages, the causes of fermentation blockages are changing more and more towards the points mentioned. So far, microbiological monitoring of fermentation has played no role in cellar management practice. The results shown here are by no means new, but they again illustrate the immense time advantage – up to five days earlier than the fermentation curve – microscopic monitoring has in comparison to simple fermentation control. Whether with the old microscope, the new Oculyze or in the wine laboratory, microscopic fermentation monitoring is an incredibly valuable improvement in the early detection of fermentation blockages and can save a lot of stress, work and many unnecessary wine mistakes. Even after the first autumn it can be seen that there are no reasons not to tap into this new, old technology for yourself.
DAS DEUTSCHE WEINMAGAZIN • 17.8.2019
Learn how to prevent stuck fermentations with Oculyze Fermentation Wine Assistant!
Also, you can now get access to a fully functional demo account to test our Web App. Completely free of charge and with no commitment to purchase.


