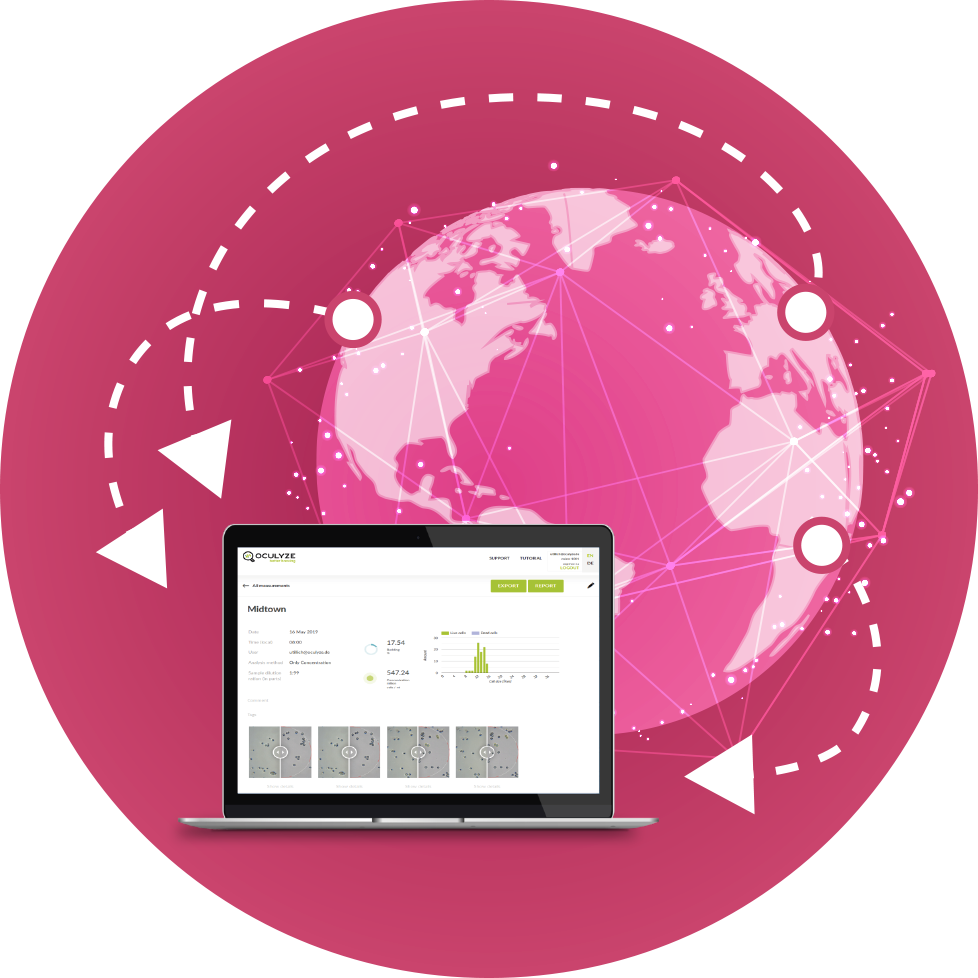
Oculyze System Web App

Your data is safely stored in the cloud, that means you can access it from anywhere
Features Oculyze web app:
Your data is safely stored in the cloud, that means you can access it from any browser.
The web app allows you to work with your previous measurements. It gives you access to data incl. images, allows you to aggregate data to create reports or timeline graphs and to export your data to data backups (which is always a good idea). If you will, it is a more powerful version of the “history view” you know from the app.
- The main page will show each measurement by name, date and concentration (viability if available).
- The result page shows more details on a single result. The user can see the images as recorded and also the analyzed results (showing the highlighted yeast).
- The “Report button” will generate a PDF including all data selected in the appearing pop-up.
- The “Export button” will create a zip file for all selected measurements incl. recorded images, result images and a csv file with all raw data of the individual measurements.
- You can also combine the results of various measurements to create a plot over time of the concentration and viability of the various selected measurements.
- Need to edit data from a previous measurement? “Name”, “dilution values” and “Comment” can be edited.
Any questions?
Contact [email protected]


