The Better Brewing App Now Has a New Feature: Fermentation Tracking
We’re happy to announce the launch of a new feature to our Better Brewing App: Fermentation Tracking. Other minor design changes were also implemented to facilitate the use of the app, along with this new feature that will help you get even more control over your fermentations.
So let’s get to it and check out the main changes!
The Homescreen
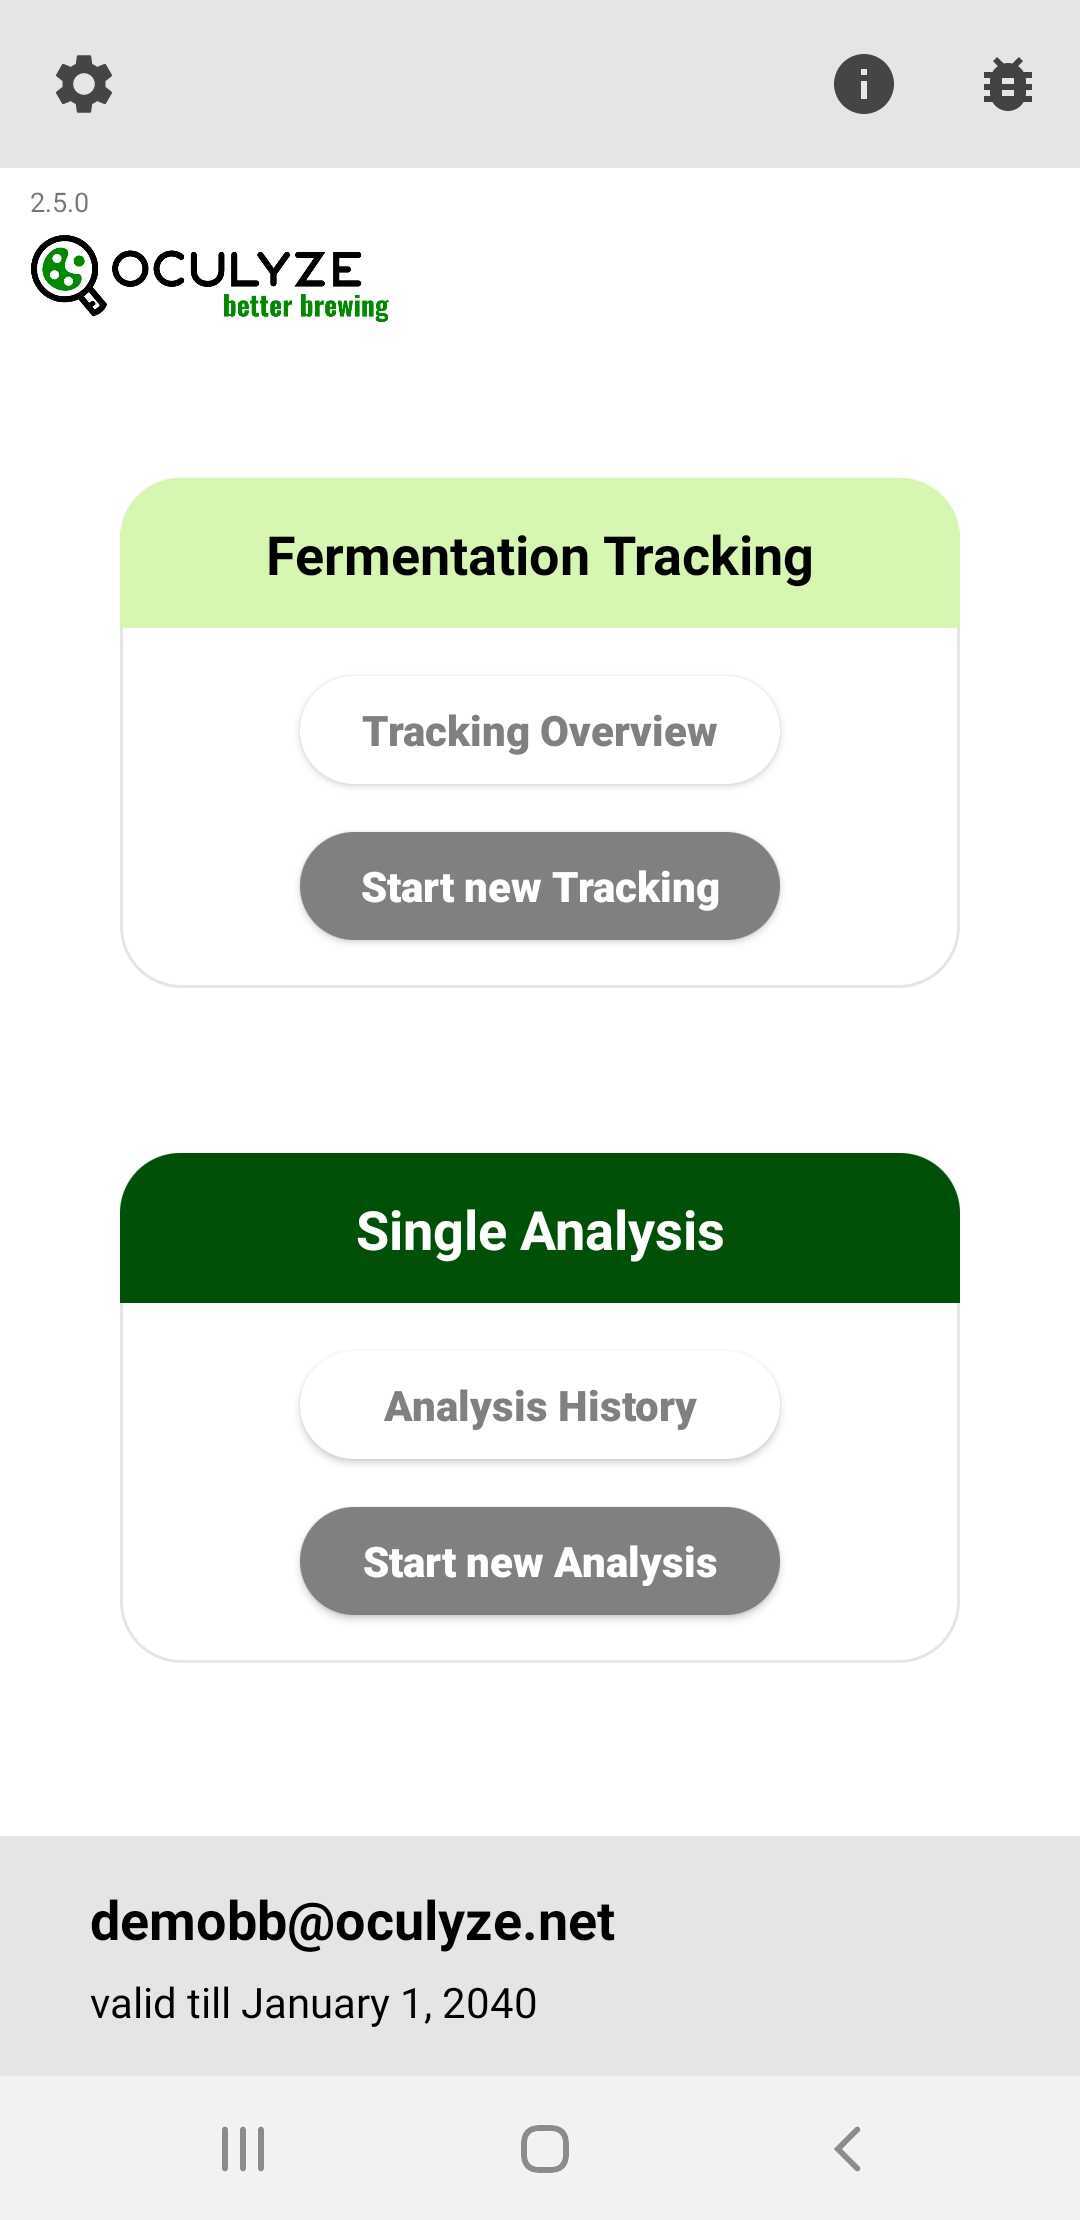
You’ll notice right from the start that the homescreen looks a bit different. That’s because we’ve added the fermentation tracking feature (about which we’ll talk later on) and we’ve reorganized and redesigned the buttons for the single analysis.
Everything is very intuitive and you can continue to do your single analyses, if you prefer, or you can also check out our cool new Fermentation Tracking Feature.
Single Analyses
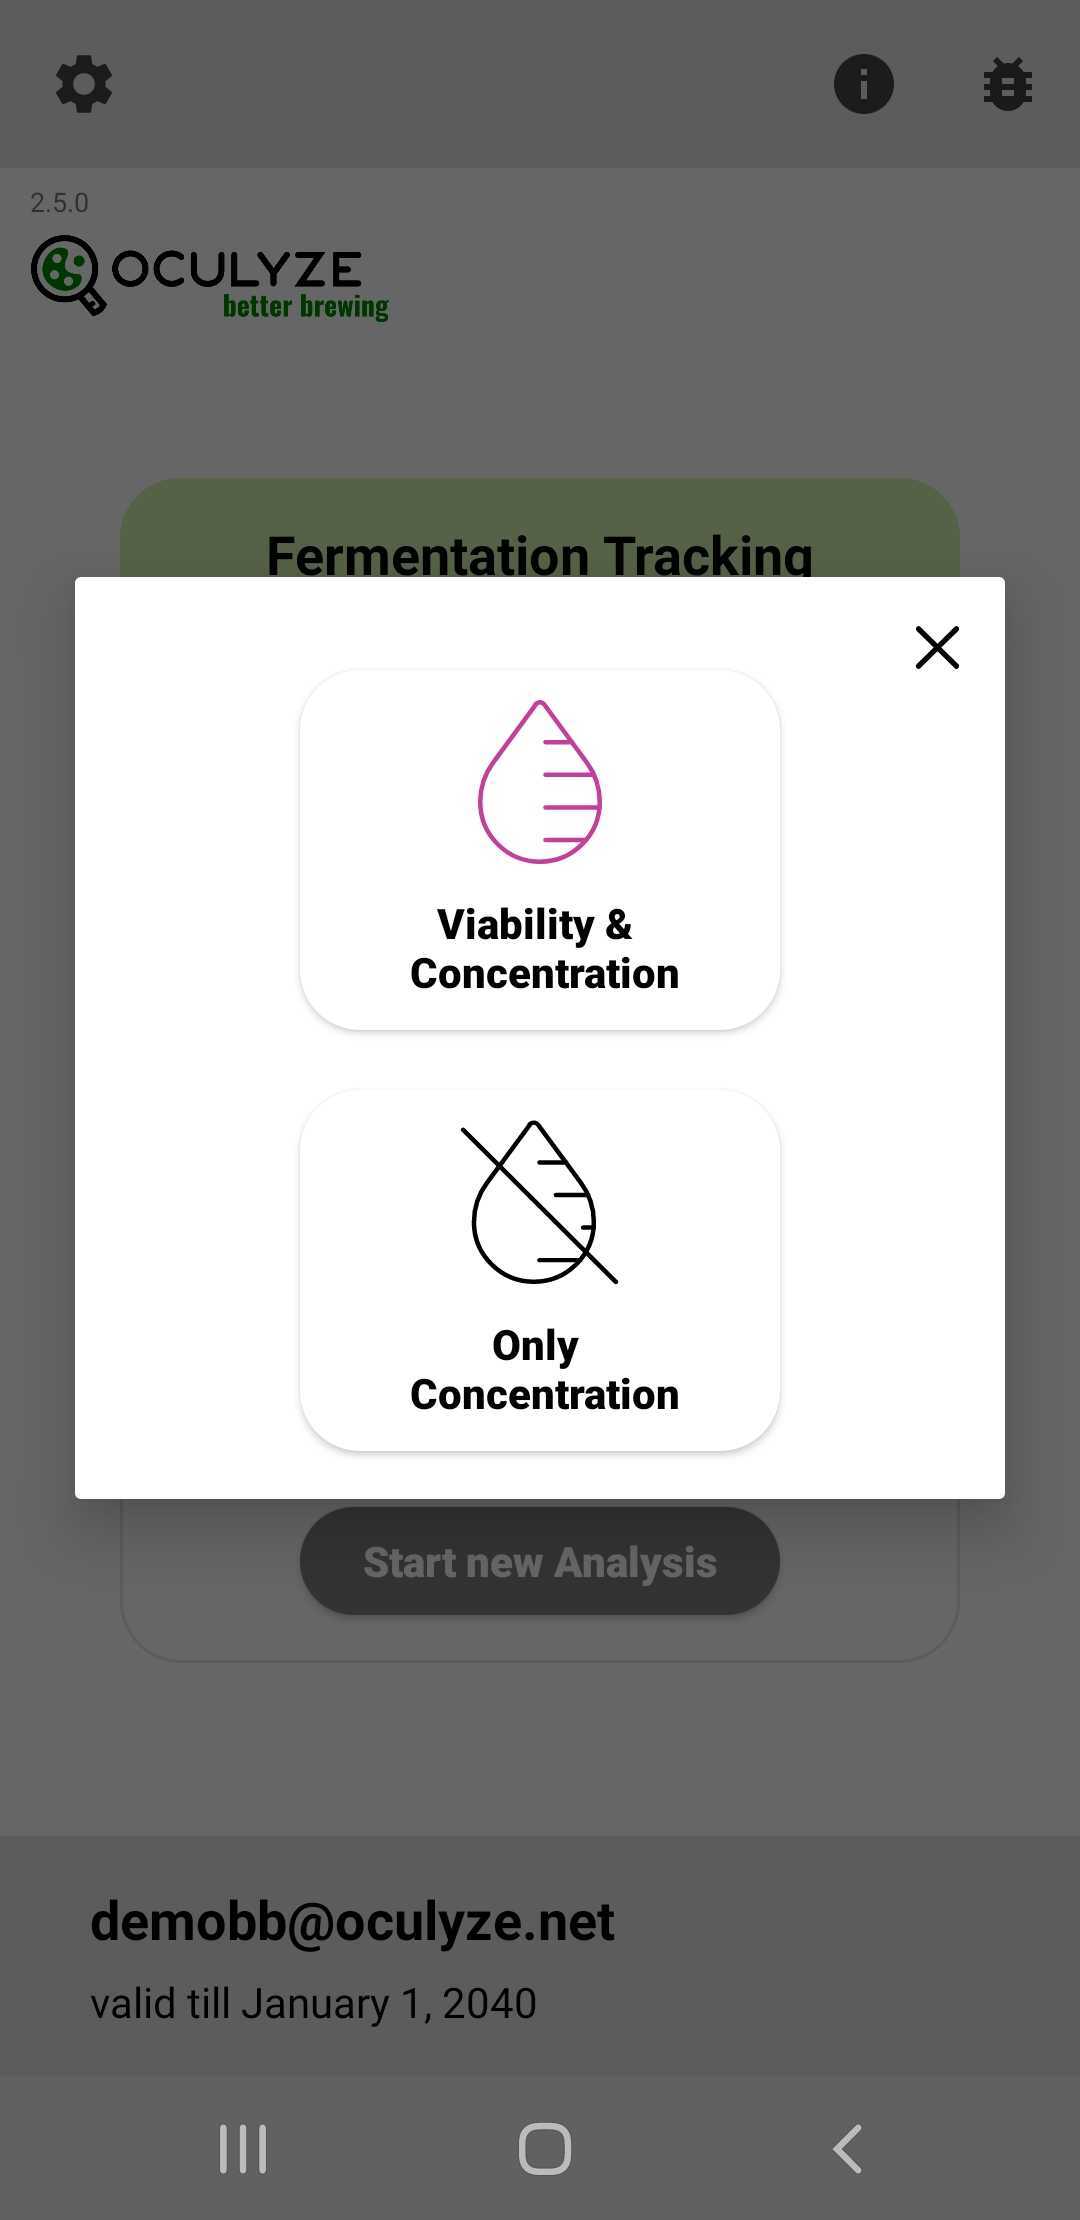
If you do decide to go with a single analysis, just click on “Start New Analysis” and you’ll get to the screen below and to the two buttons that you were used to seeing on the Homescreen:
- Viability & Concentration
- Only Concentration
From here on, it’s business as usual and you already know what you have to do.
Tracking Overview – Main Page
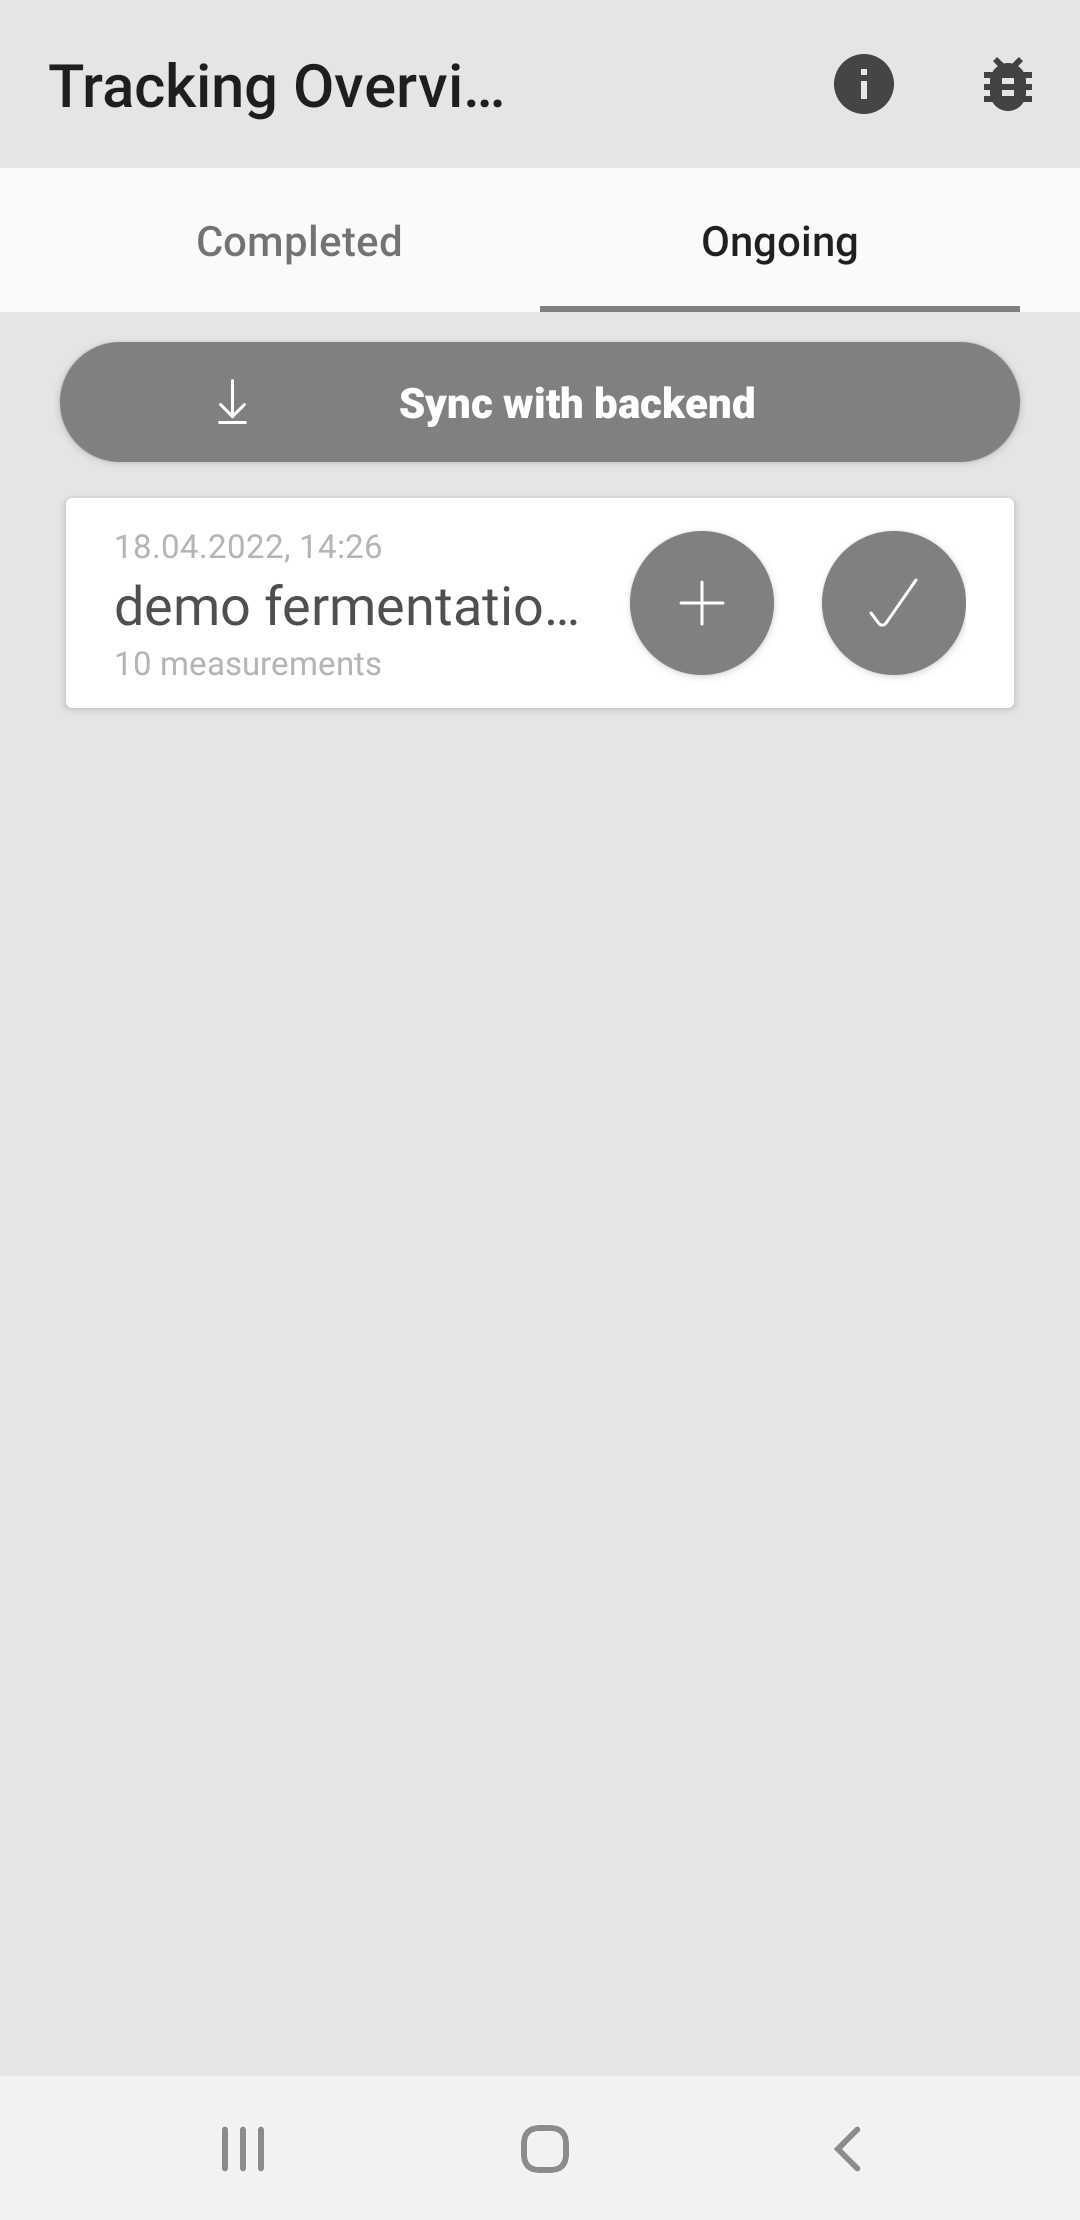
If you decide to check out our new Fermentation Tracking feature (which we highly recommend), and you click on Tracking Overview, you’ll get to a list with all your trackings. Here, you can create a different tracking for each of your fermentations, to follow it from start to end. To each fermentation (or tracking), you can add more analyses by clicking the “+” button, or you can finalize a tracking by clicking the “check” button, once your fermentation is complete.
Tracking Overview – The Graph
Just click on any tracking (corresponding to a certain fermentation) from the list to see the overview.
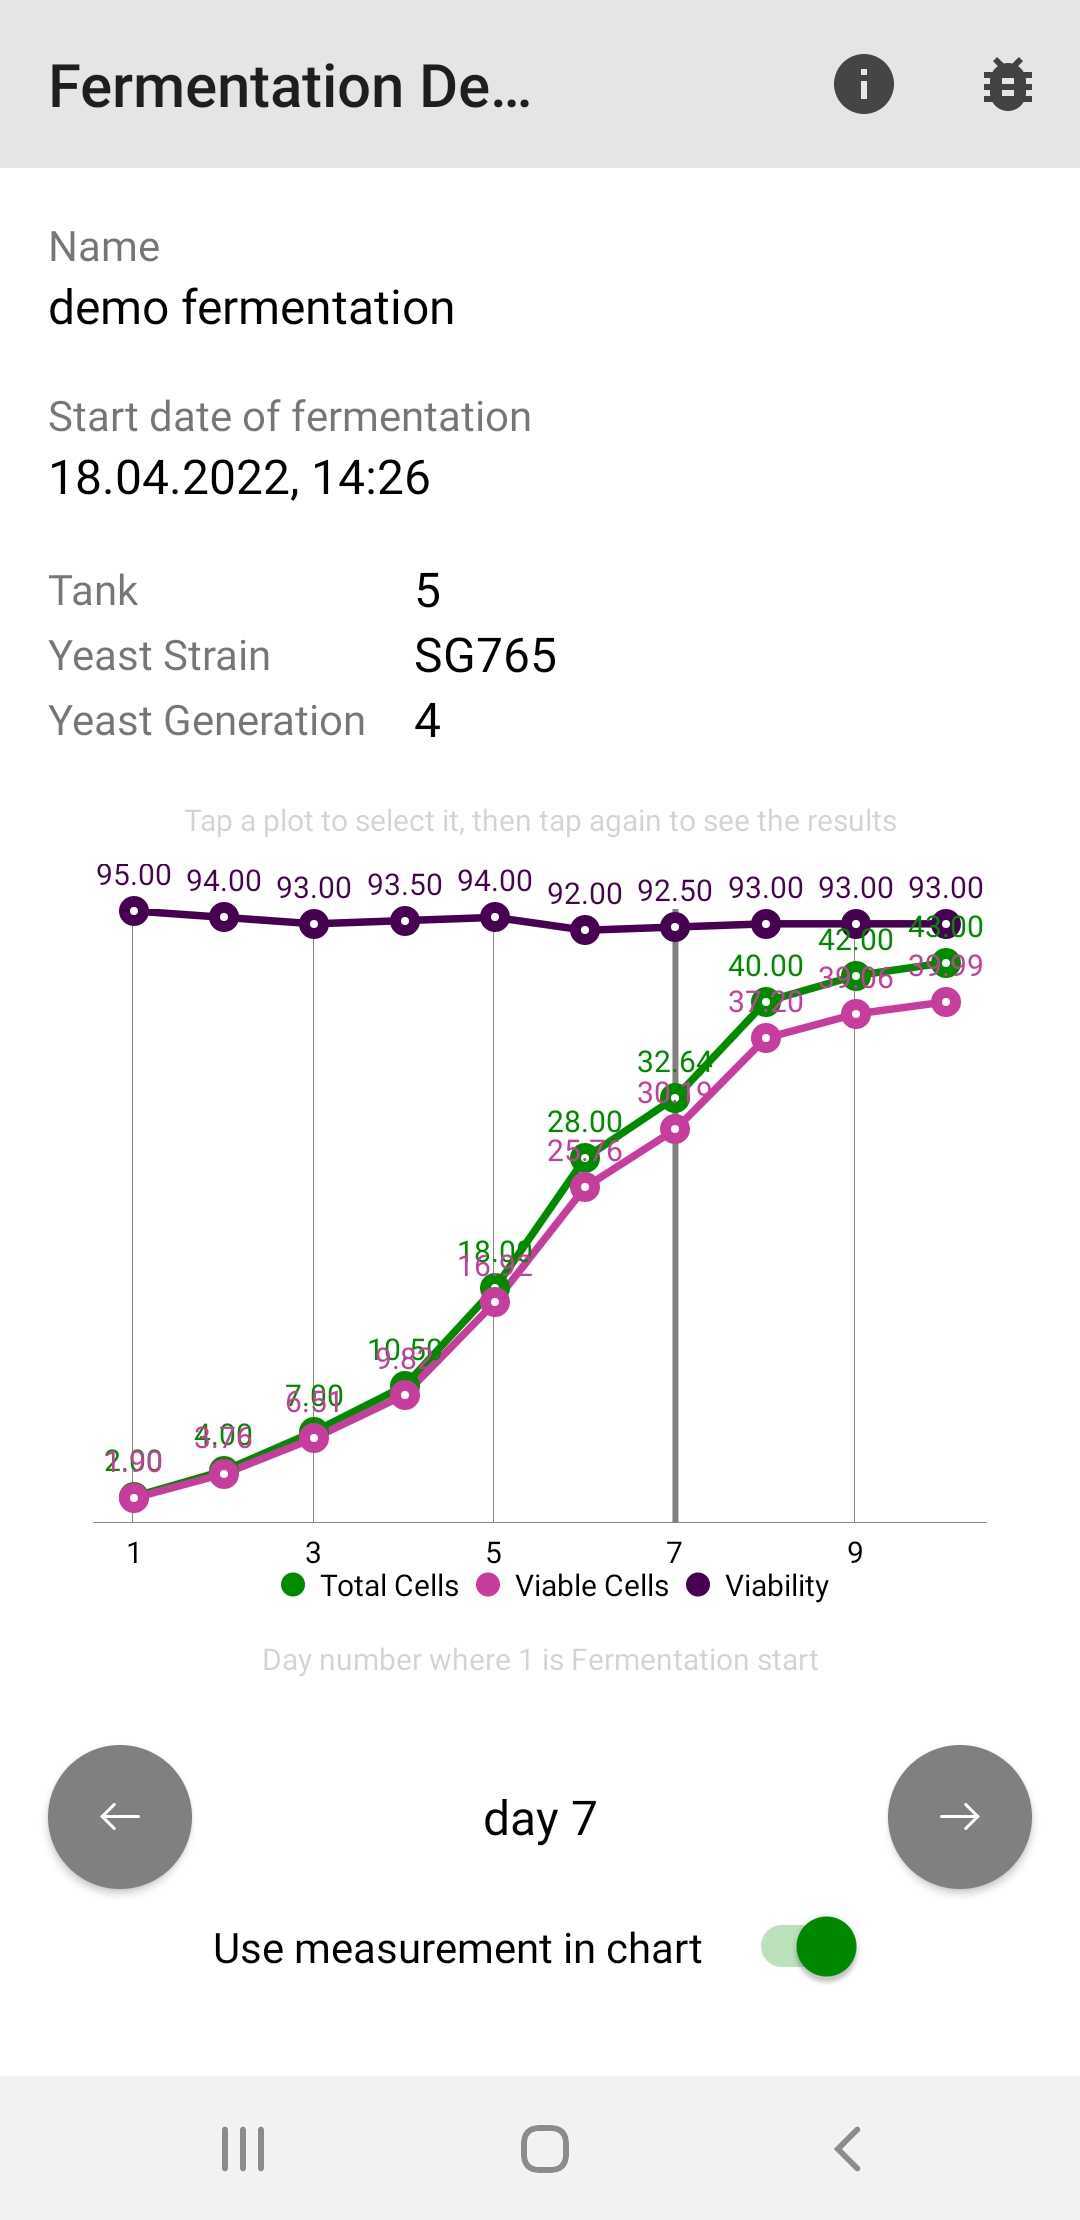
On the top of the page (see the image below) you can see all the info you added when creating a new tracking – such as the name of this particular tracking, the start date of the fermentation, the tank, the yeast strain, and the yeast generation.
The graph comprises the results of the different measurements you’ve taken during this particular fermentation – the yeast concentration (in green) and the yeast viability (in purple). In dark purple, you’ll see the viability in percentages, while in light purple it’s the viability by cell numbers.
Interpreting the Graph
The example above shows an almost perfect fermentation – the yeast grows at an optimal rate (it doubles every day), while the viability stays high.
If something were to go wrong, you would immediately notice it – you may notice a drop in yeast growth or in viability.
But this is just the basics of what this feature can do for you. Additionally, there are several valuable insights and benefits you may get from monitoring your fermentations so thoroughly, such as:
Ensuring consistency between batches
You can use the new Fermentation Tracking feature to compare the fermentations of different batches of the same beer when, for example, you’re using different generations of the same yeast. By carefully monitoring the fermentations and comparing the graphs, you’ll know that your fermentation is consistent between batches, but you’ll also know exactly when a new generation of yeast no longer performs. This invaluable insight into your fermentation means that you will no longer need to rely on sensory evaluation to assess consistency which, of course, requires more man-hours and extra costs.
Getting valuable information on slurry quality
By comparing different fermentations from batch to batch, you can also get important insights regarding the quality of the fraction of slurry that was collected for repitching. If the slurry hasn’t been collected correctly, the yeast might be too flocculent and sediment too early, in which case you will notice a faster decrease in cell concentration from one batch to another. If, on the other hand, the yeast is not that flocculent, it will remain in suspension for longer, so you should notice a higher concentration of cells.
Helping you determine the normal curve of fermentation
The new Fermentation Tracking feature can help you determine what the normal curve of fermentation is (and consequently) should be for each batch, whether you’re brewing several types of beer using various yeast strains or you’re brewing more batches of the same beer using different generations of the same yeast. This means that you’ll know exactly what to expect from each batch you brew and you can take measures immediately if the yeast growth is not optimal (which would be visible on the graph).
What does that mean for you? Well, less stress over sticking to the production schedule and, of course, cost savings by optimizing the tank occupancy time.
Allowing you to experiment more with your yeast
By monitoring and comparing your fermentations, you can decide for yourself, instead of relying on hearsay evidence, whether, for instance, a new strain of yeast works or not for you, whether it performs as you need it to or if maybe it has a longer fermentation time than what your brewery can handle. Having control over the whole process may embolden you to experiment with using the slurry from one type of beer to another or add ingredients (or different quantities of the same ingredients) that otherwise you wouldn’t have used, fearing the way they may interact with your yeast.
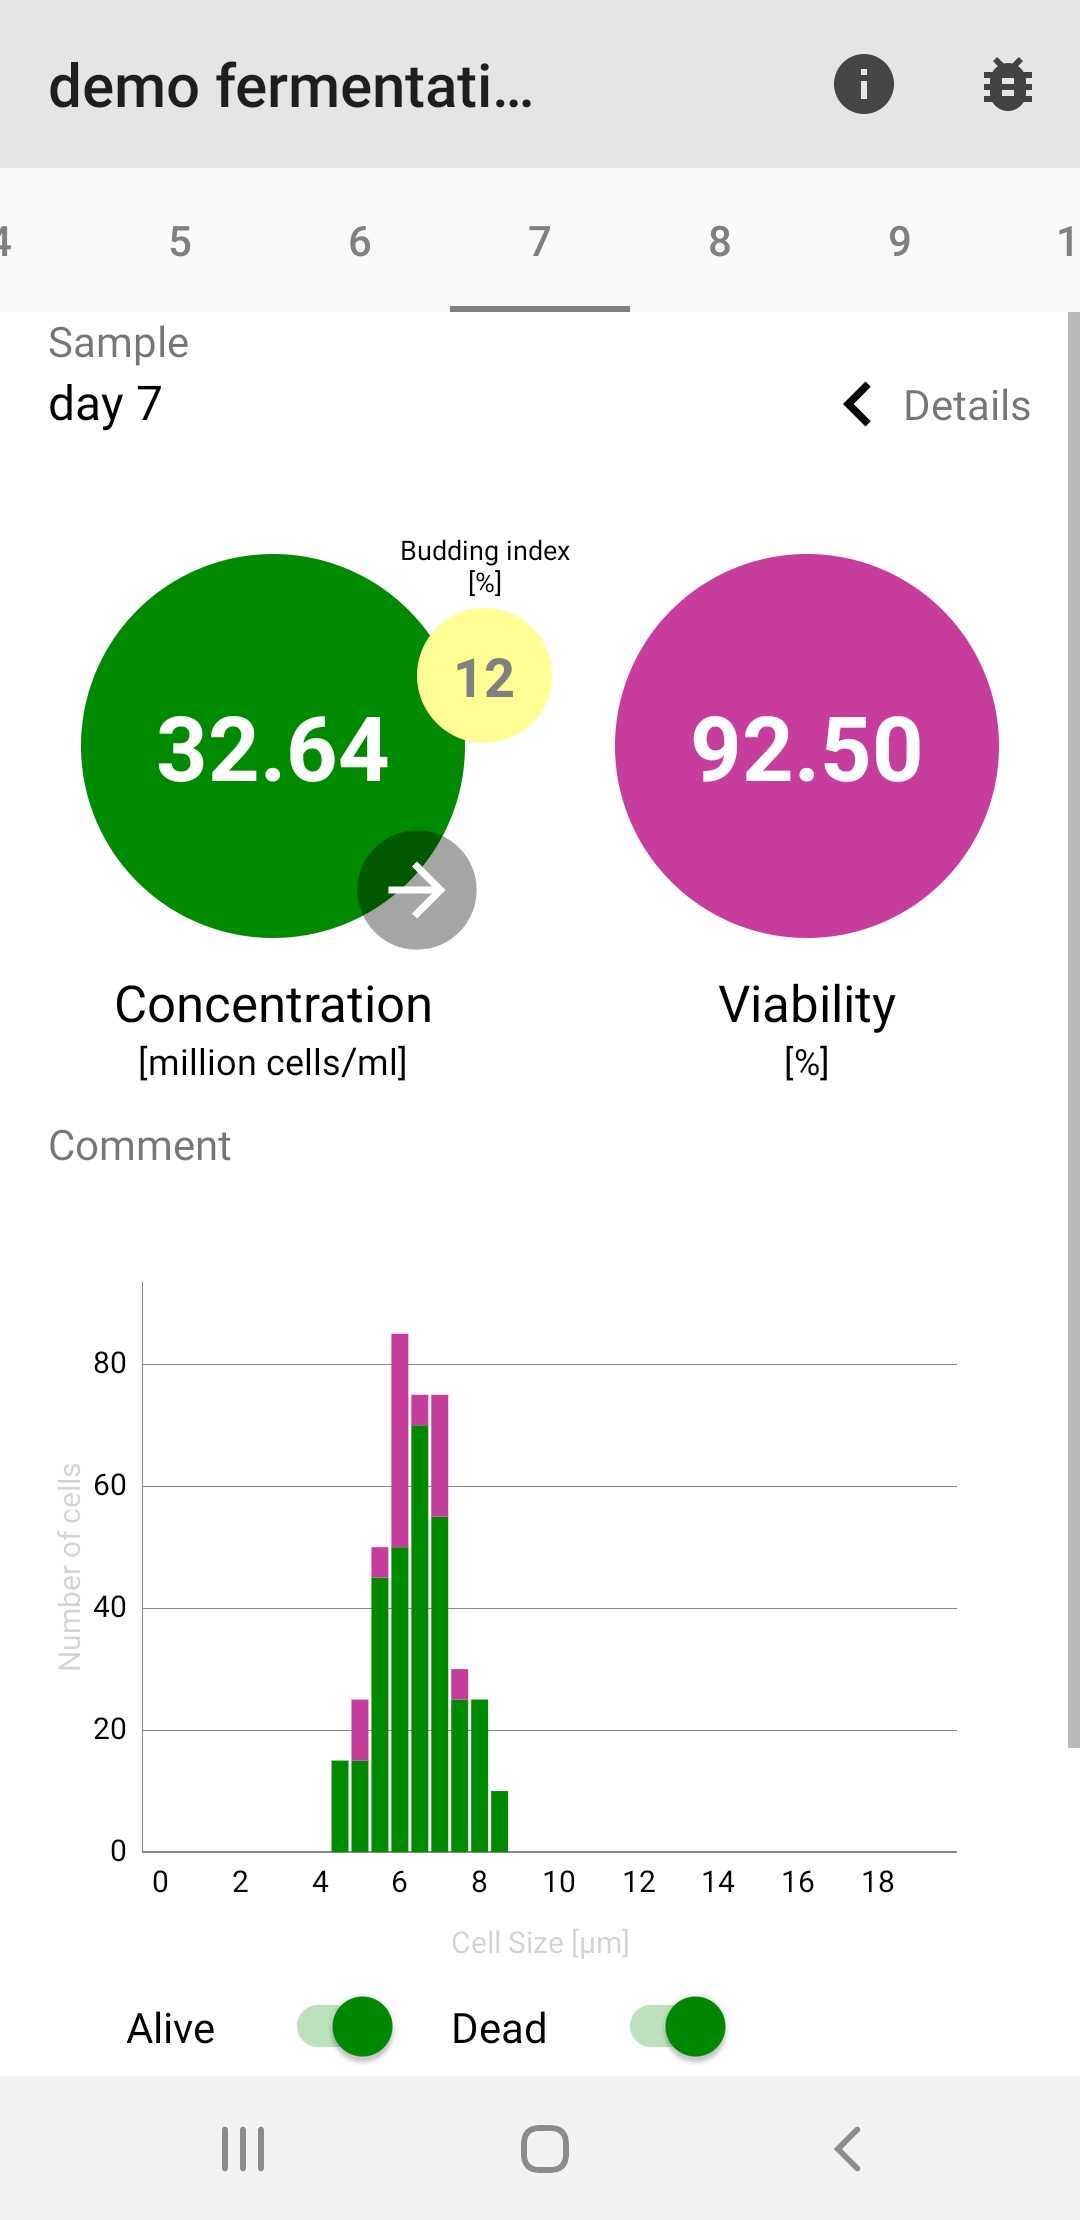
Checking Out Single Measurements from the Graph
If you want to check out a single measurement from the graph, either select one data point in the graph or click on the name of the currently selected analysis that you’ll see appearing under the graph. From here on, the results view is the one you’re already used to (from the single measurements), and for more information on your different single measurements, you can just swipe through them in this view.
That’s it! Enjoy the new feature and updates and, if you have any additional questions, don’t hesitate to drop us an email at [email protected]!


