Login Page for the Fermentation Wine Web App
The FW Web App can be accessed under https://webapp.oculyze.net/
Opening the webpage directs you to the login screen. The login uses the same access data that is used for the Android App. Enter the relevant data in the fields Email and Password and press the button Login.
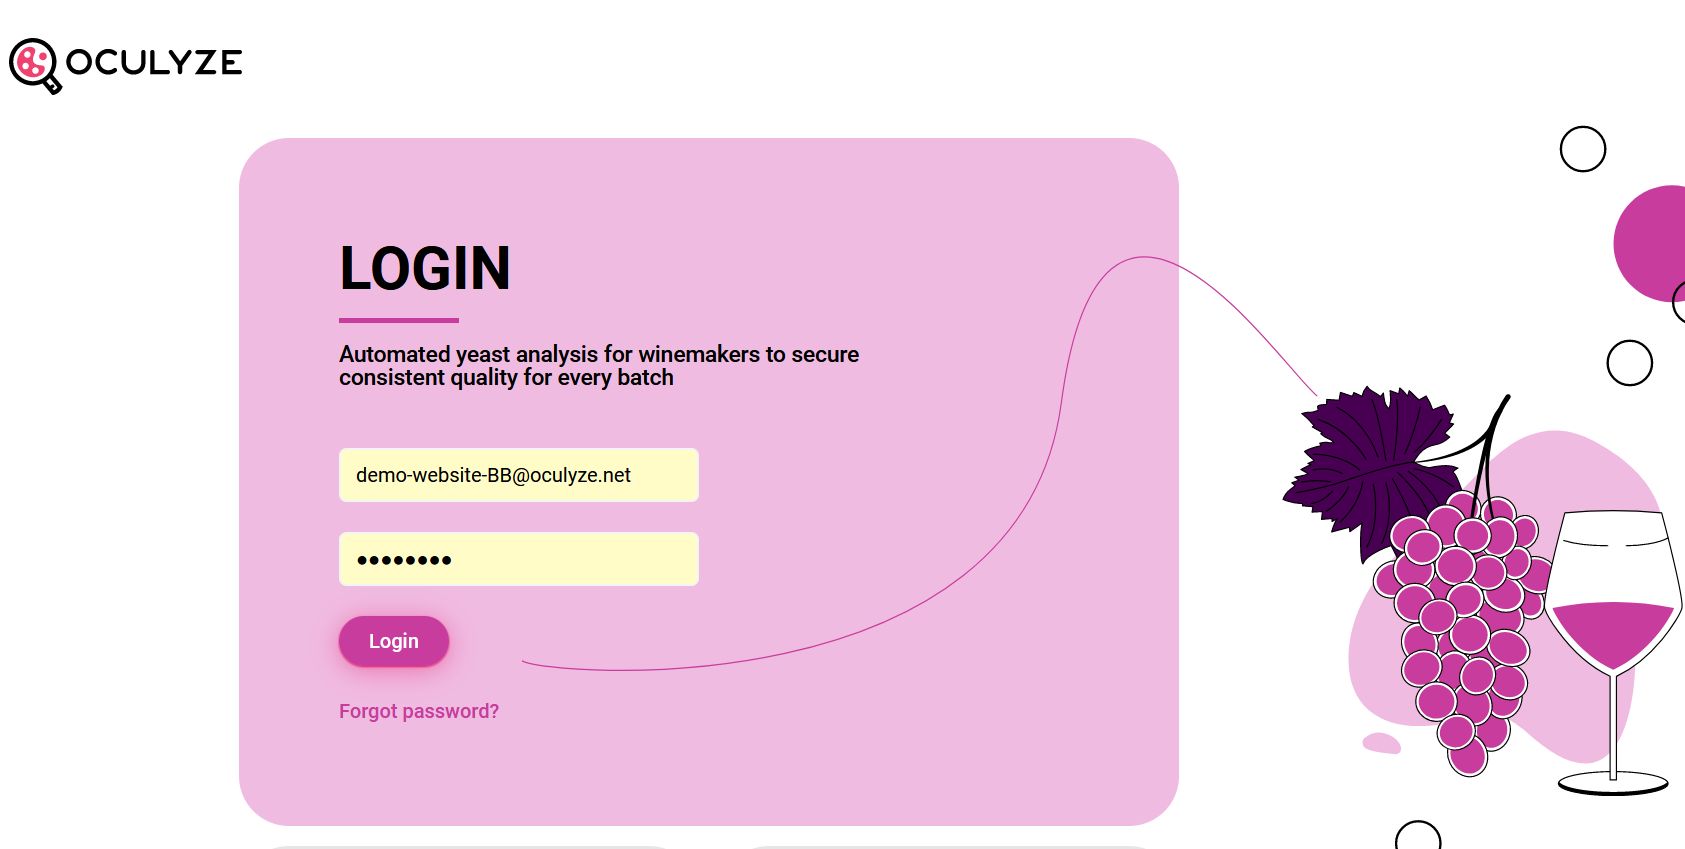
The main page opens automatically.
The main page
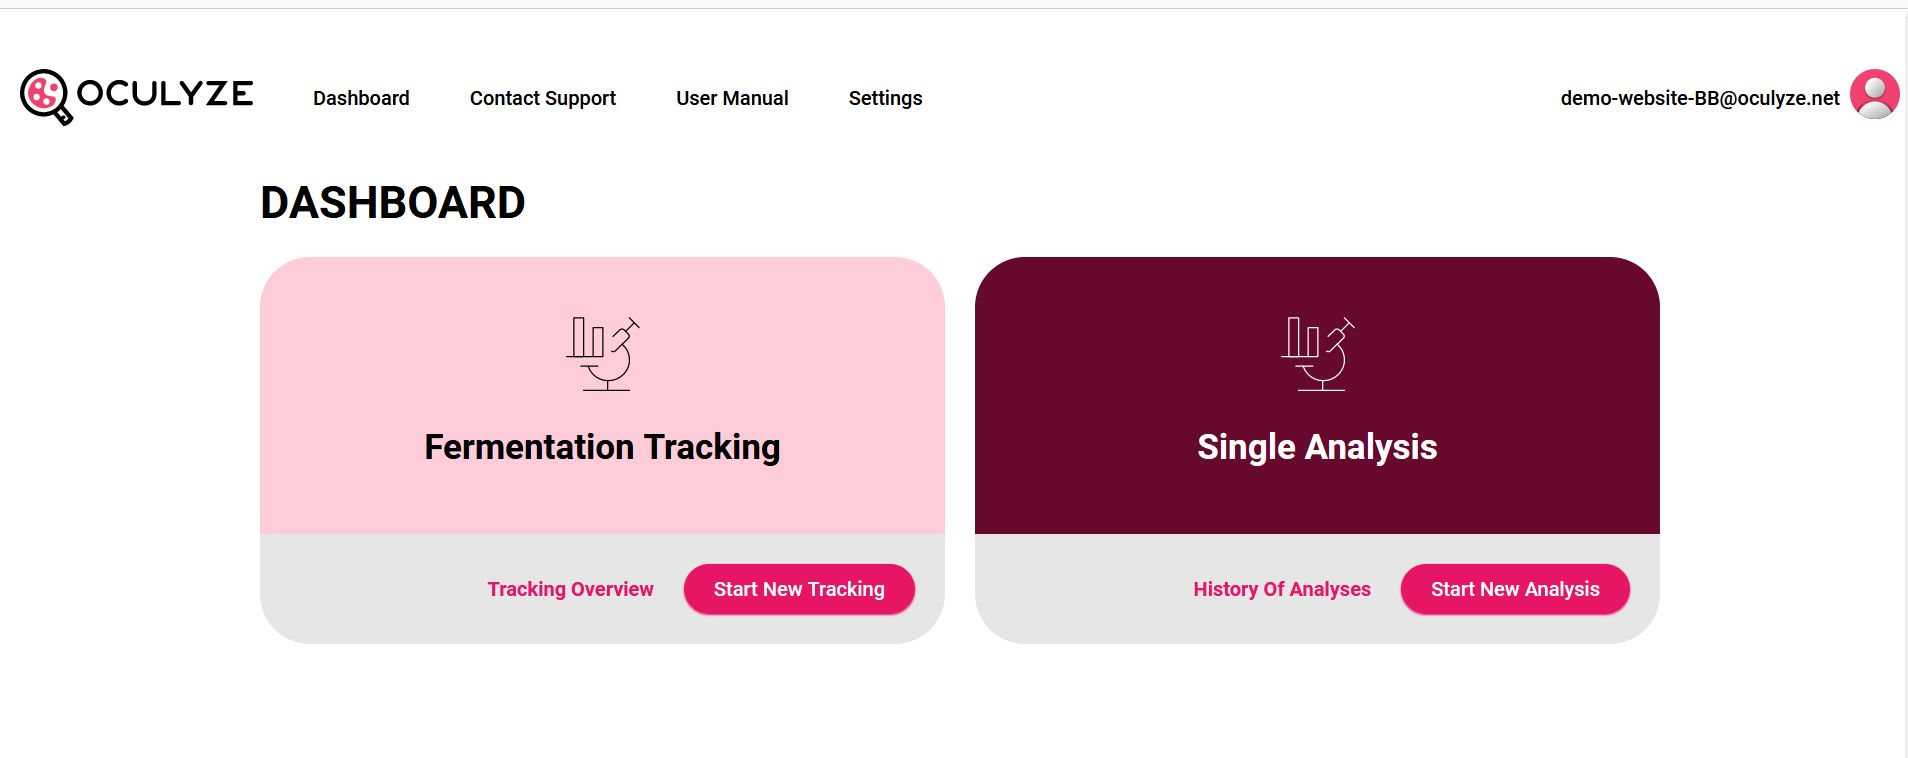
After a successful login, the main page opens.
On this page, you’ll be able to:
- Start a new analysis;
- See the history of analyses;
- Start a new tracking. Find out more about Fermentation Tracking here.
- See an overview of all your previous tracking.
The head section gives you access to the following functions:
- Contact Support – Opens a window to send us a message;
- User Manual – Links to the main Resources page;
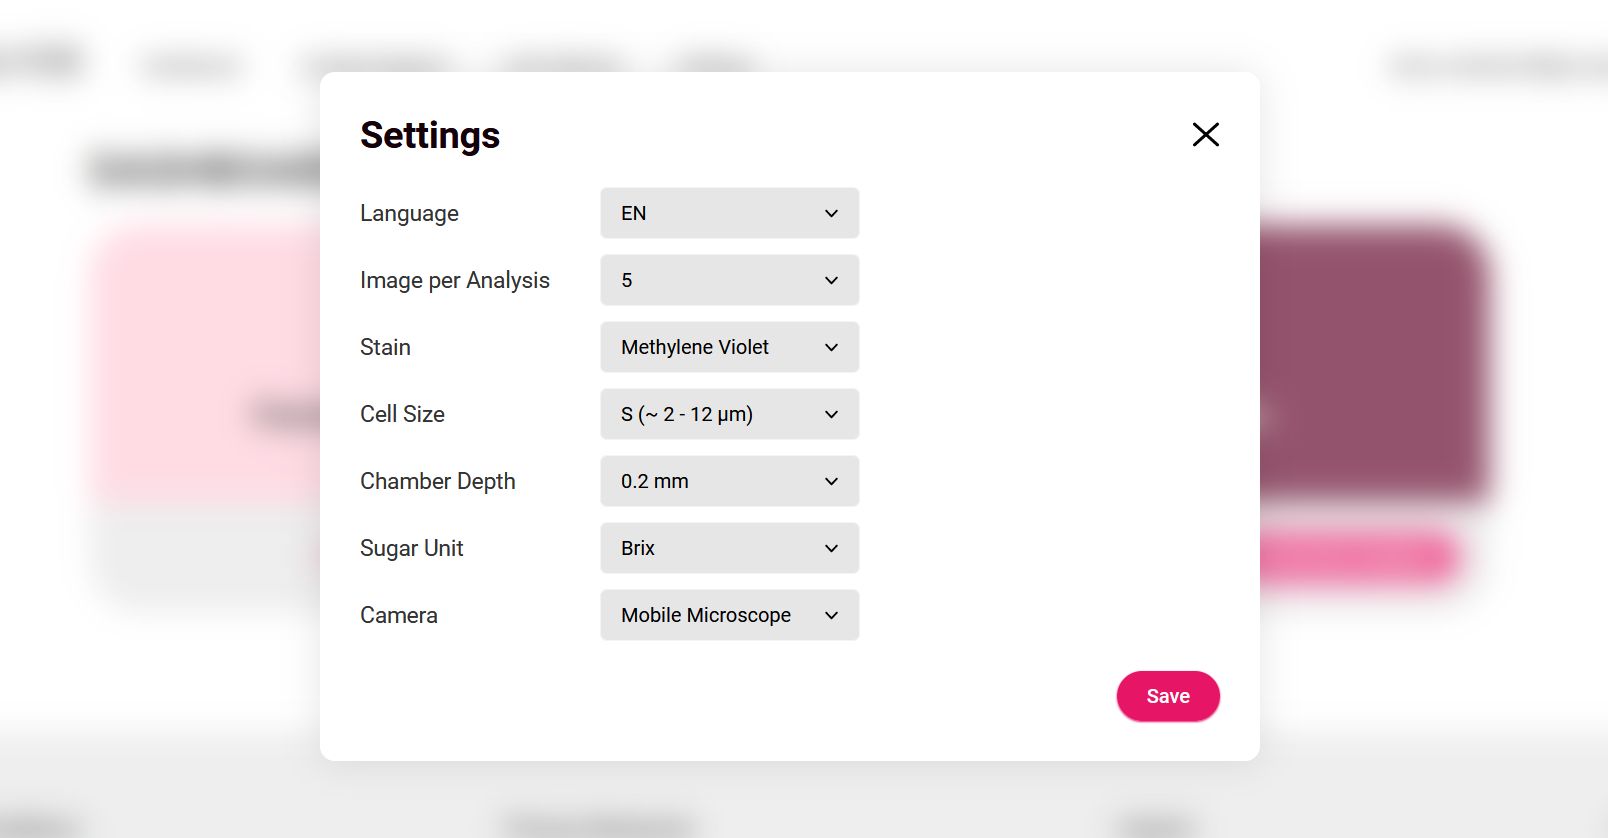
- Settings.
Overview of single fermentation wine measurements in the FW app
All individual measurements are listed on this page and can be accessed via the Main Page. Each measurement is displayed as a list entry with Name, Date, Viability, and Concentration. Further details of the measurements can be accessed by clicking on each of them.
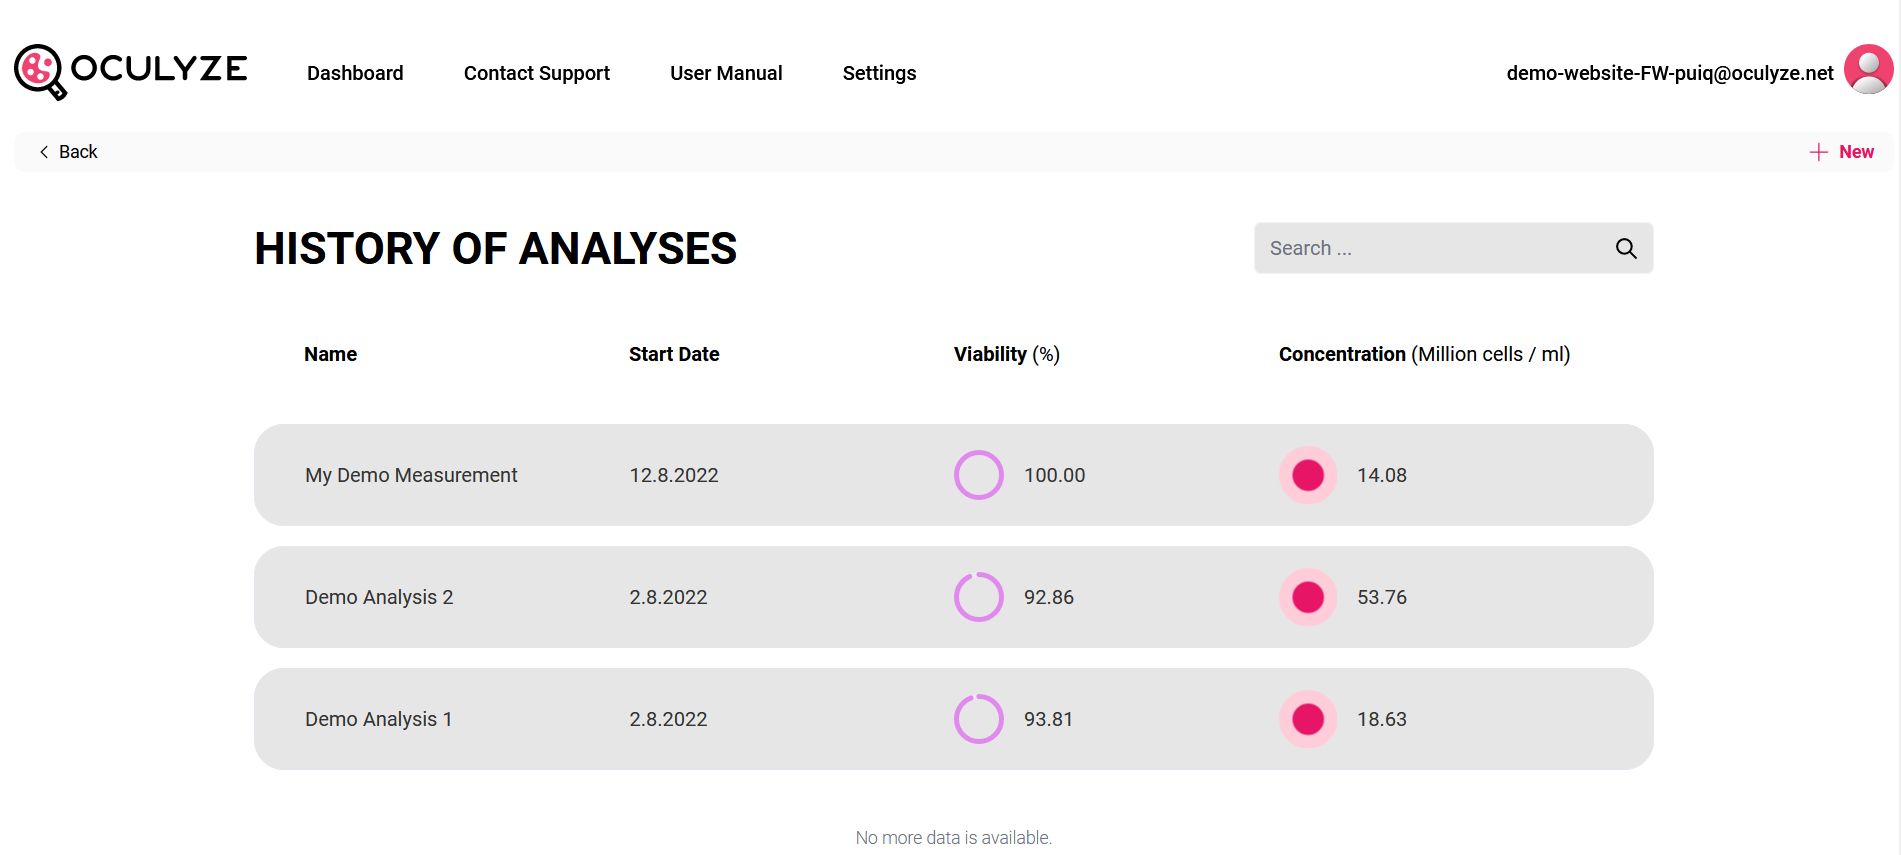
In addition to the functions already explained for the Main page, further functions are accessible in the header:
- Navigation arrow – The arrow takes you back to the Main Page
- Advanced search – Allows you to filter measurements.
- By clicking on a single measurement, the details for this measurement are displayed on a new screen.
Single measurement details in the fermentation wine Web App
This page shows all information of a single measurement. It can be reached via the Overview of Single Measurements.
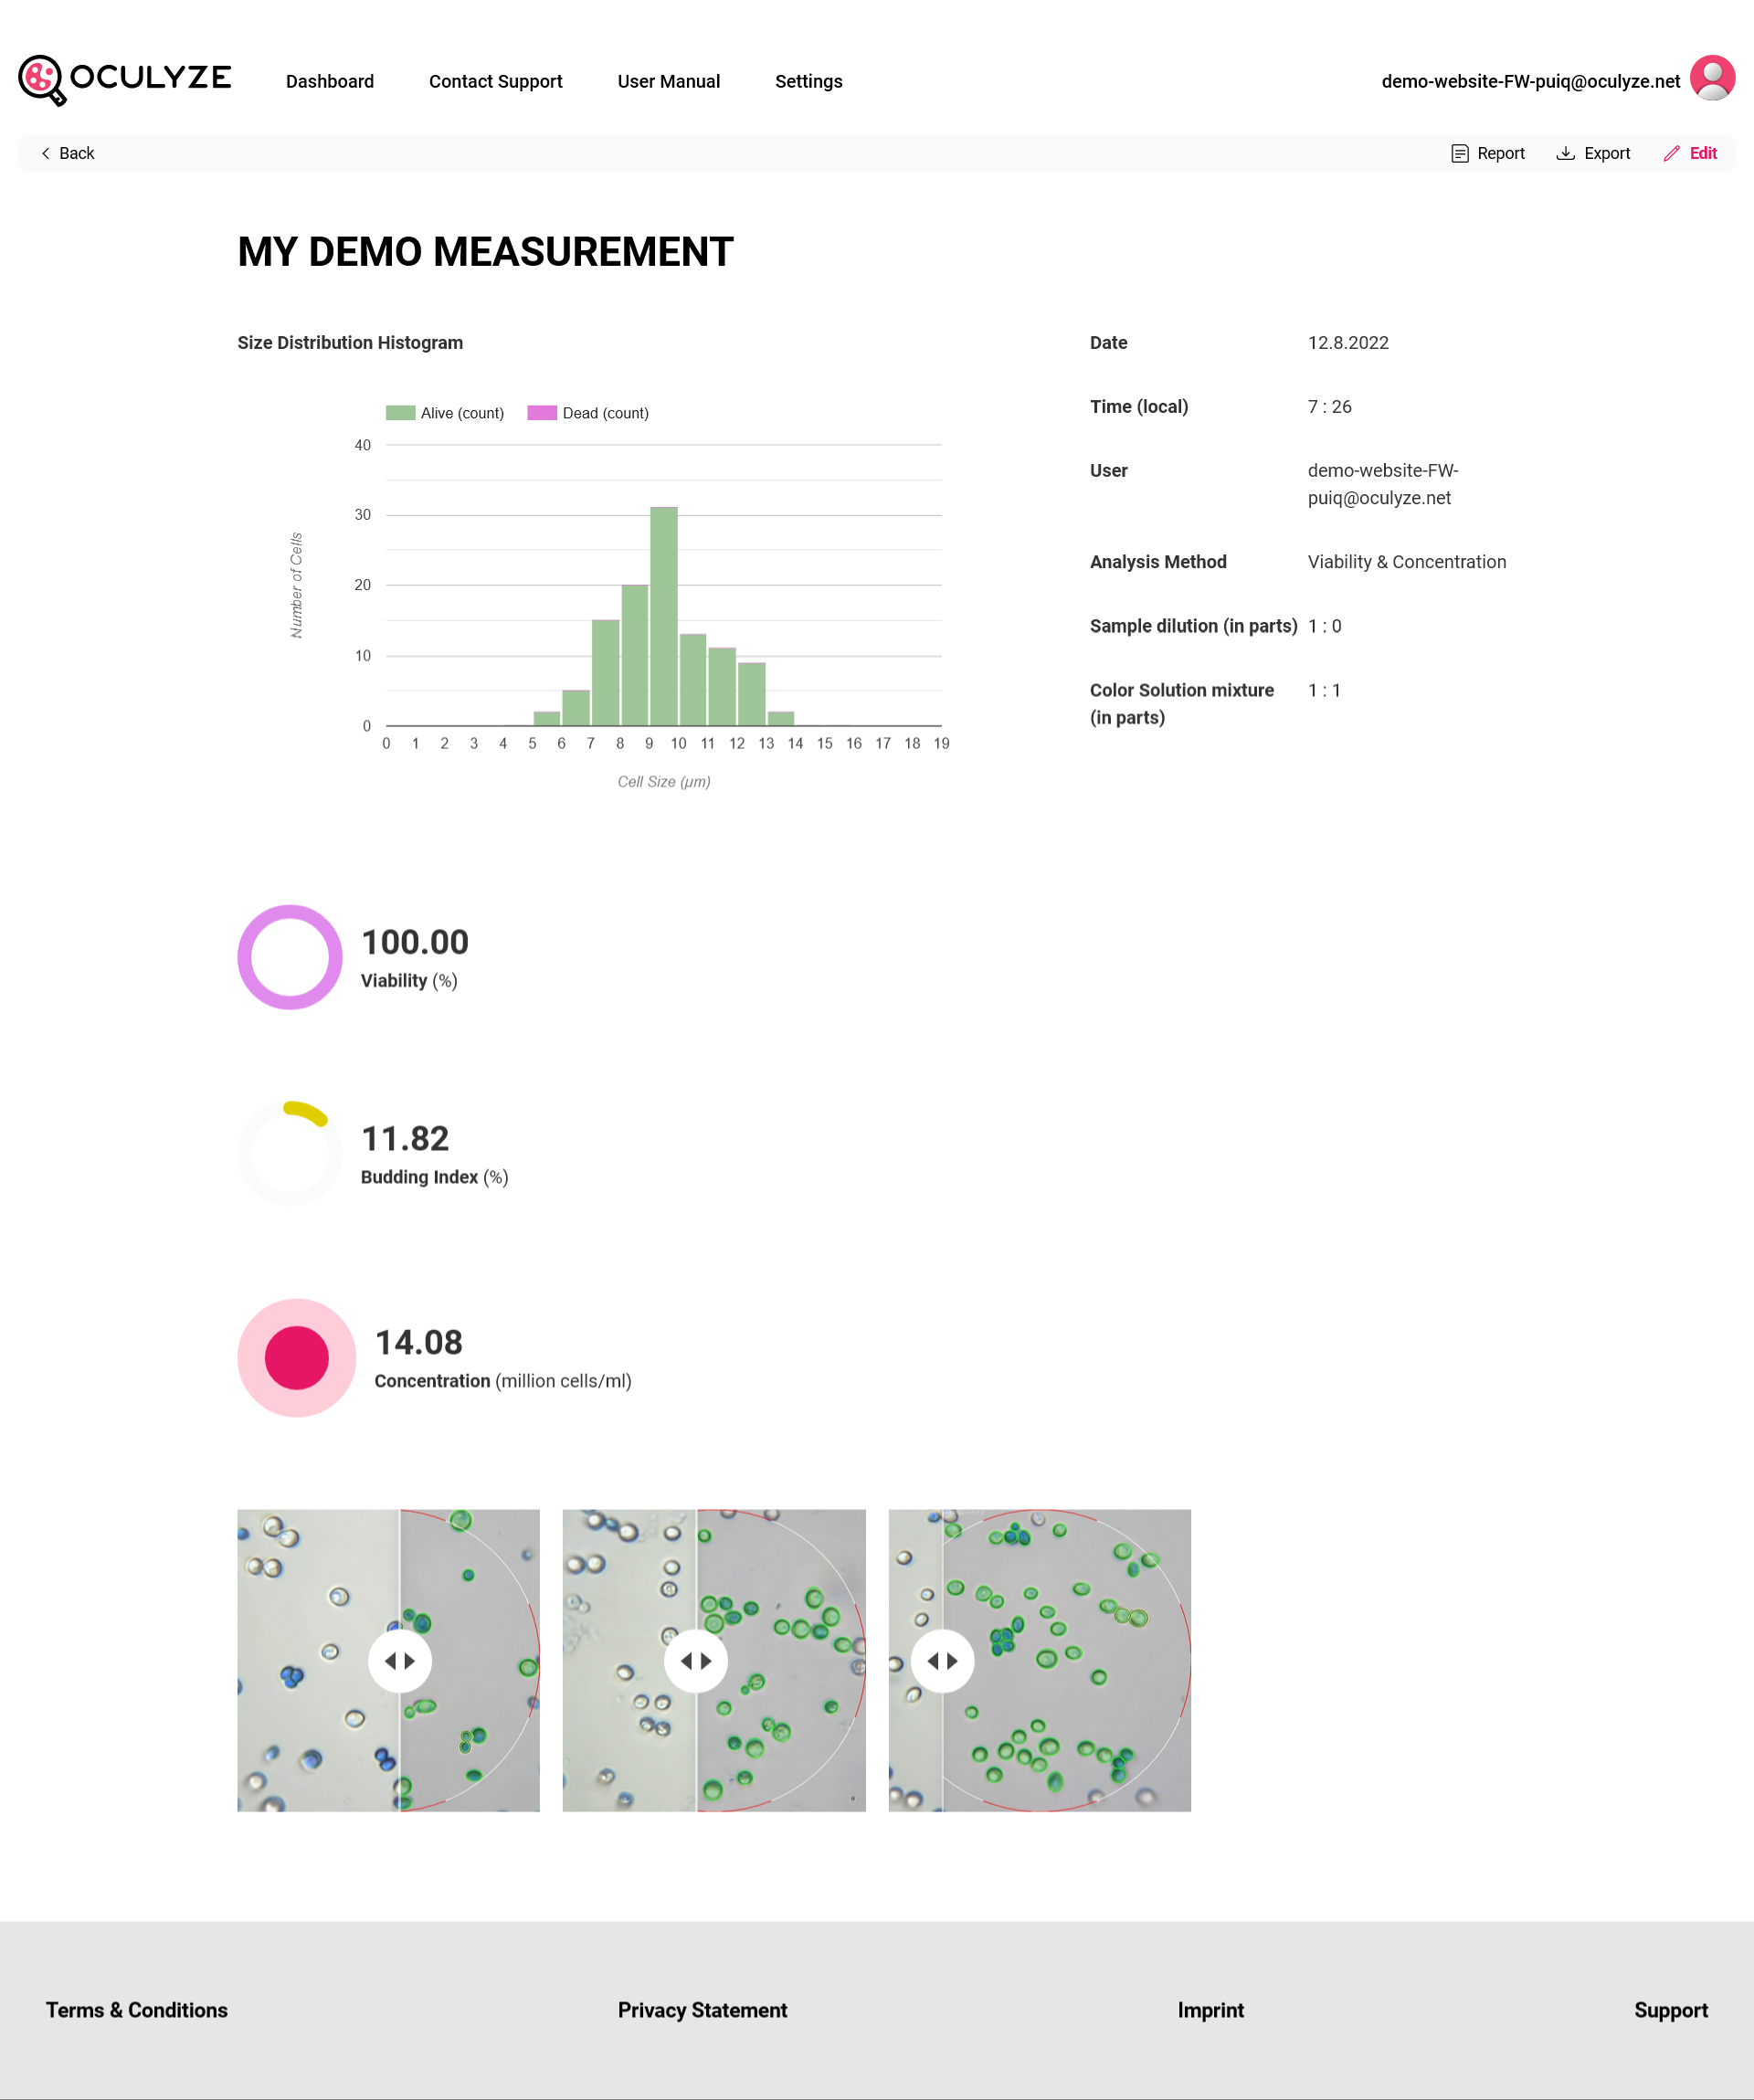
The page is divided into:
- Sample details with sample name, date and time of the measurement carried out, user, and the analysis method.
- Sample dilution – Indicates the values entered in the app for the dilution of the sample with water in parts.
- Dilution of the staining solution – Indicates the values entered in the app for the dilution of the sample with the staining solution in parts.
- Viability – Indicates the determined proportion of living cells in % of the total number of cells in the sample.
- Budding – Indicates the determined proportion of budding cells in % of the total number of cells in the sample.
- Concentration – Indicates the calculated total cell number of the sample in million cells/ml. The concentration displayed refers to the undiluted sample. The information on dilution and mixing provided by the user are factored in during calculation.
- Histogram – Displays the distribution of cell sizes in the sample. The green bars correspond to the living and the purple bars to the dead cells. Overall larger cells indicate an older yeast population, as the cells grow larger with each budding (splitting).
- Result images – To check the image analysis, the result of the image recognition can be superimposed with a slider. The pictures can be enlarged by clicking on them.
In addition to the functions already explained for the Main Page, further functions are accessible in the header:
- Export function – Generates a zip file for the measurement including recorded images, result images, SVG-file of the histogram, and CSV file with all raw data.
- Report function – Creates a PDF including all data selected in the appearing pop-up.
- Edit function (pen) – Enables editing title, comment and dilution values of the measurement.
By changing the dilution values, the concentration is recalculated. Please note that the page has to be reloaded in order to display the newly calculated value.
Ongoing and completed fermentations in the FW Web App
Selecting Tracking Overview under Fermentation Tracking on the Main Page (or Dashboard) opens a new overview that shows the individual fermentations in a list.
![]()
In addition to the functions already explained for the Main Page, further functions are accessible in the header:
- Navigation arrow – The arrow takes you back to the Main Page;
- Advanced search – Allows you to filter.
By selecting a single fermentation, you are directed to the individual display:
Individual fermentations in the FW Web App
All data about a fermentation and the associated individual measurements are summarized on this page.
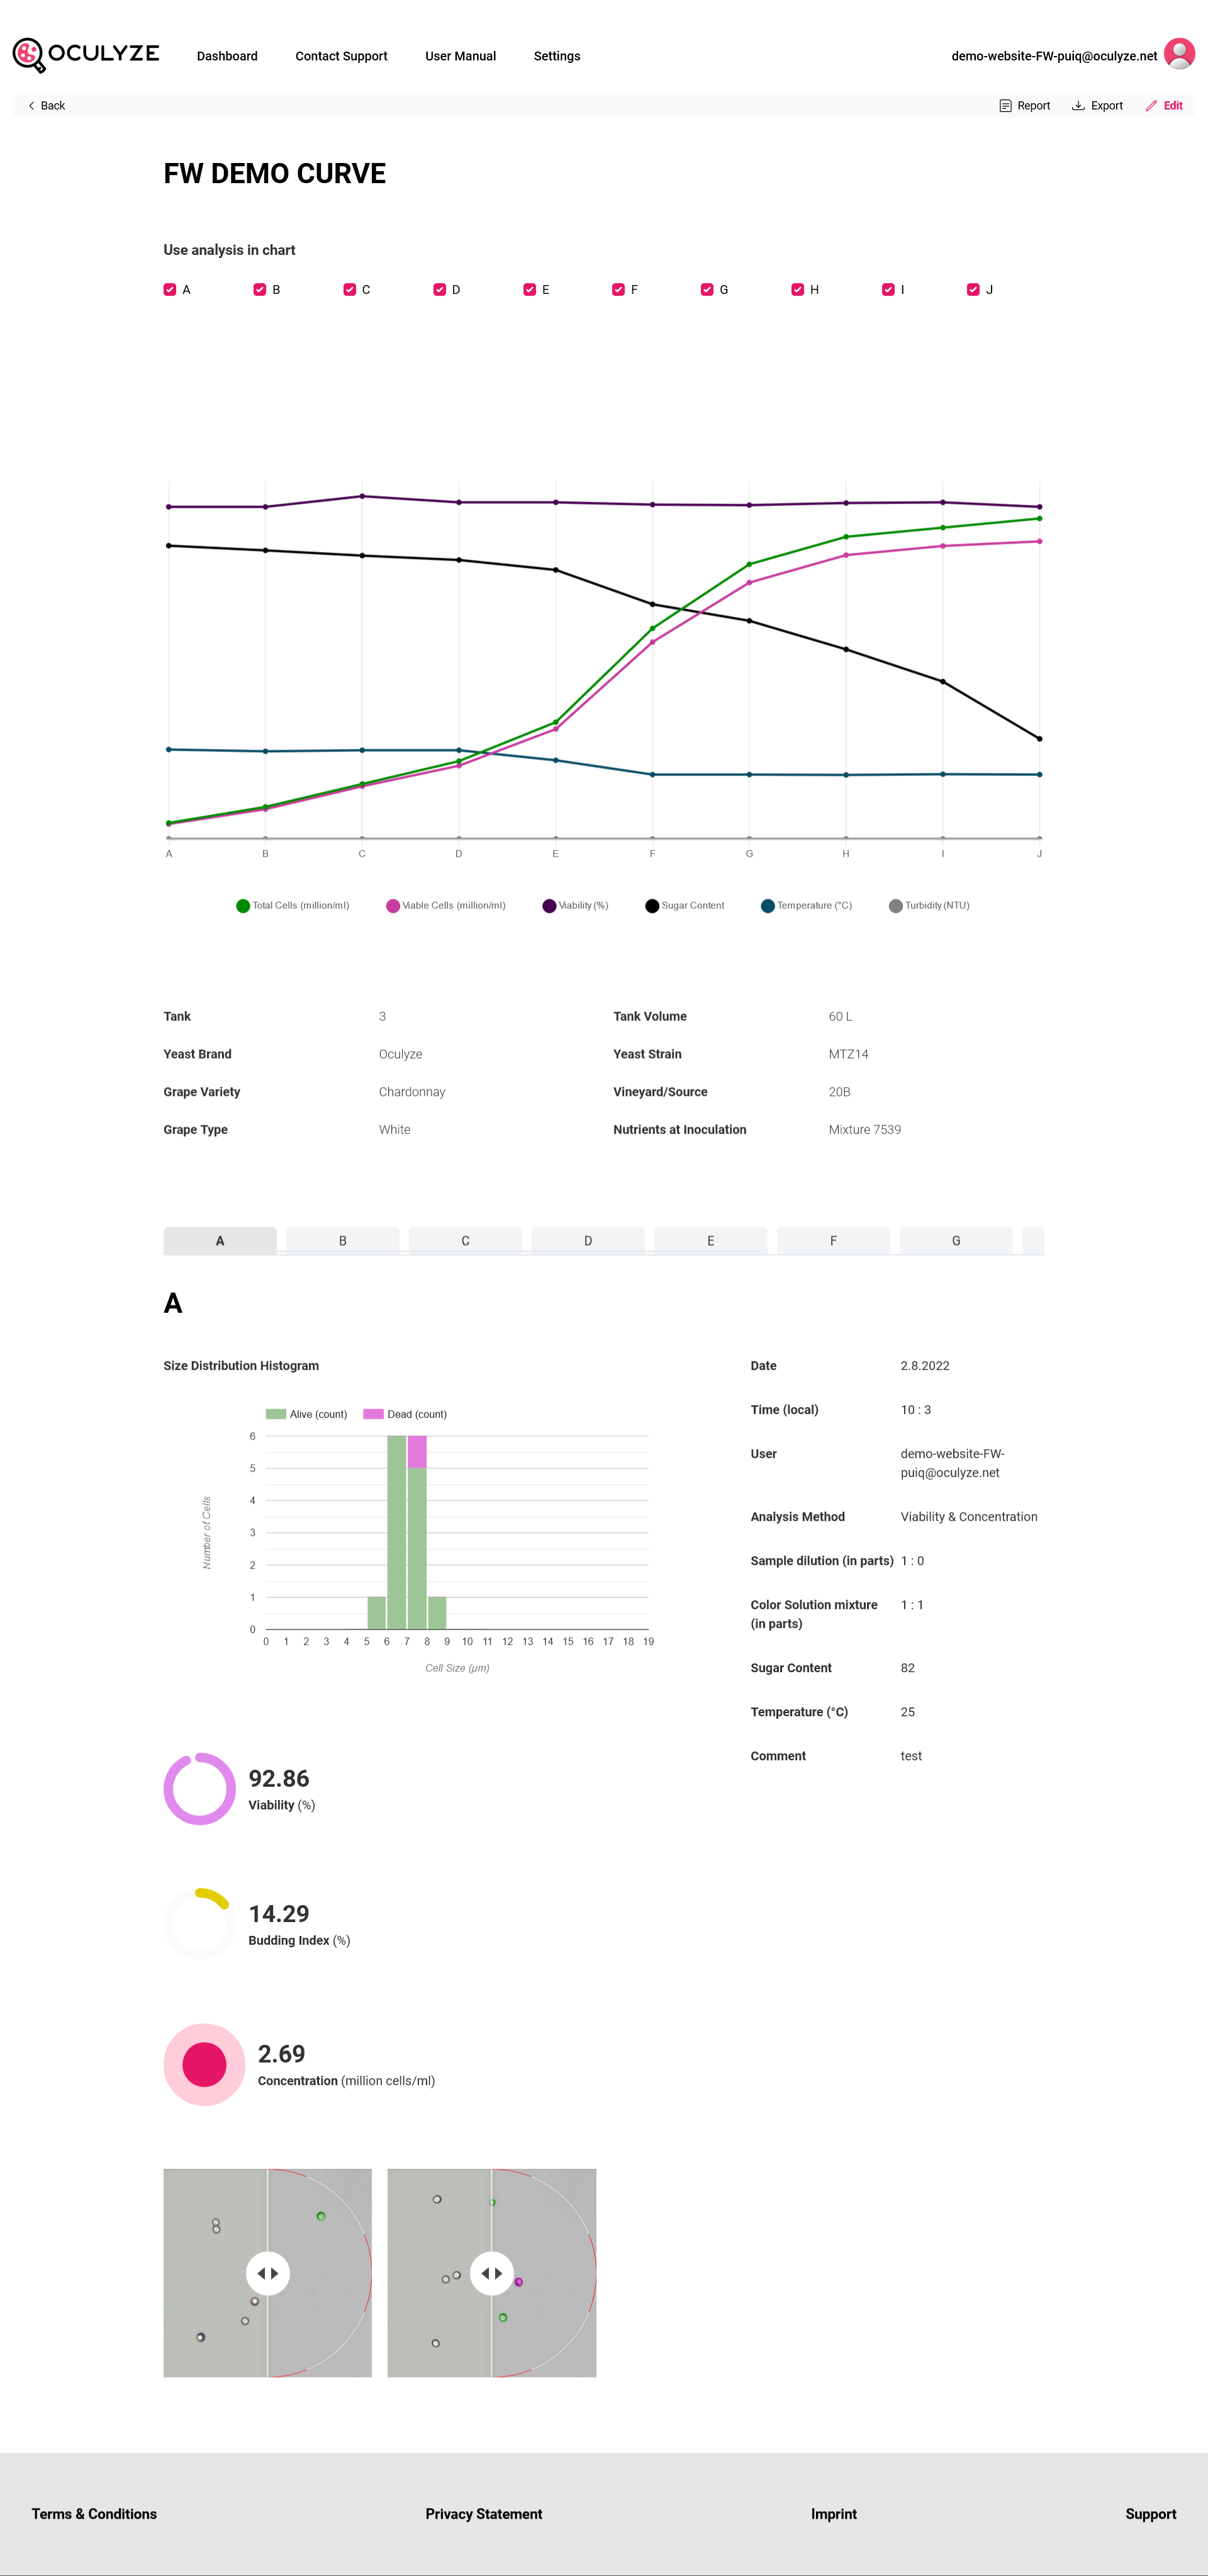
The page includes summary graphs of the selected individual measurement for:
- Total Cells (million/ml)
- Viable Cells (million/ml)
- Viability (%)
- Sugar Content
- Temperature (degrees Celsius)
- Turbidity (NTU)
It also includes a list of the individual measurements (above the graph) that allows you to select the individual measurements you wish to be integrated into the graph. Further details of individual measurements can be accessed by hovering your mouse over the individual values in the graph.
Additionally, you can choose to hide a measurement in the graph (such as the sugar content, temperature, etc.) by simply clicking on it.
Finally, you also have the report/export functions, just like for the individual measurements.