ISO Particle Count Chart: What Does it Show

If you’re engaged in any industry that requires filtration of air, fluids, or solids, an ISO particle count chart is likely essential to your work. Even if you’re not directly involved in the day-to-day operations of keeping your fluids clean, it can be helpful to understand how the ISO cleanliness code works and what the chart means.
What Is the ISO Cleanliness Code?
Ensuring fluids like oil and other lubricants remain free of contaminants is a critical part of running any machinery.
In clean air labs, filtering the air is necessary to ensure clean spaces for the manufacture of life saving medicines, the exploration and investigation of bacteria and viruses, and the production of materials that will travel into space, to name just a few reasons.
Thus, an international cleanliness code has been designed and agreed upon by dozens of participating countries to ensure a uniform language is used around the world to ensure trade and communications remain of the highest quality.
We refer to potential contaminants as ISO particles, with ISO representing International Standards Organization. Those particles are measured in microns, which are typically understood in terms of the concentration per unit volume, which could be particles per cubic meter or particles per cubic foot.
We measure the smallest possible unit, which is a micron, understood in the metric system to represent one-millionth of a meter or one-thousandth of a millimeter.
Why do we measure so small?
When working in clean rooms, with clean liquids, or with clean solids, even the most microscopic particle can cause a tremendous amount of damage.
Bacteria in water can cause severe illness, tiny metal particles in lubricants can slowly erode the gears in machinery, and viruses or other contaminants in air can disrupt the positive function of chemicals used to save lives.
For this reason, the ISO cleanliness code was created.
We need particle counters because the naked eye can only see particles as small as 40 microns, and the particles that can cause so much damage can be up to 10 times smaller than that.
Understanding the Iso Particle Count Chart
When using a particle counter, whether it is monitoring air, oil, water, or a solid like metal, you could use a stationary machine that sits in one place and measures air as it circulates around the room, a mobile counter that moves around the room, or a reader through which a fluid or solid is run.
This technology typically works by scattering light and reflecting it against mirrors, which can counts the microns of particles present.
Note that particle counters will not identify the particles identified. Rather, they simply inform you as to the concentration in the air, liquid, or solid you are testing.
A particle counter will typically provide you with a three number format, like 19/17/14, which lets you know what the contaminant level code is for each of the corresponding particle sizes.
The first number will always represent the number of particles in your sample that are 4 microns or larger.
The second number will represent the number of particles that are 6 microns or larger.
And the third number will represent the number of particles that are 14 microns or larger.
And each of those numbers stand for the power by which 2 is multiplied. So, 19 is 2 to the 19th power. 17 is 2 to the 17th power. 14 is 2 to the 14th power.
If you look at the chart, then, you’ll get a range of how many particles of each size are present in your sample.
It is also important to note that you should be taking samples of your air, fluid, or solid over time, as each number only represents a range and not the full picture of exactly what you’re dealing with. No machine can be that accurate.
ISO particle count chart
The ISO cleanliness code is a standardized system defined by the International Organization for Standardization (ISO). The code is expressed in three numbers, representing the number of particles of a certain size per milliliter of fluid.
Here is a general guide to the ISO particle count chart:
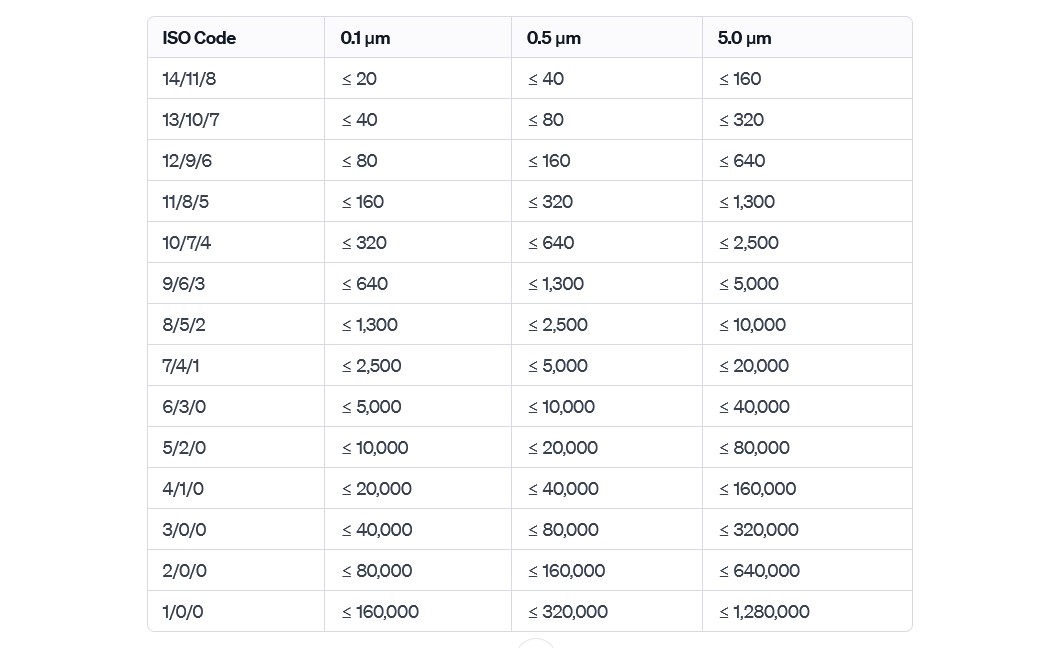
The three numbers in the ISO code represent the particle count for particles greater than or equal to 4, 6, and 14 micrometers, respectively. The chart is read as “ISO Code – Particle Count at 4 µm / Particle Count at 6 µm / Particle Count at 14 µm”. For example, an ISO code of 15/12/9 indicates that the fluid has a particle count of less than or equal to 15 particles at 4 µm, less than or equal to 12 particles at 6 µm, and less than or equal to 9 particles at 14 µm per milliliter of fluid.
You can also find some ISO particle count charts by following the links in the resource section of this article, but the truth is it all comes down to using the right chart for your particular needs and industry, and you’ll have to identify that by yourself.
Particle counting – a solution
There is a constant need for particle counters, far beyond just cleanrooms, and there are countless applications for a generic particle counter. Oculyze has designed a generic particle counter that can be applied to various uses across industries.
Using image analysis and pattern recognition, the Oculyze Particle Analyzer can be customized to your specific needs. If a specific detection is needed, the system can always be expanded and combined with a classification to differentiate what is being counted.
You can give the Oculyze system a try yourself.
All you need are some images of the particles to be counted / detected.
Just please note that the recognition provided here is solely for demonstration purposes and may not accurately represent the performance of our product. Our customers receive customized recognitions tailored to their specific needs, which ensures high levels of accuracy.
Additionally, Oculyze allows you to keep all of your information in one efficient system designed to aid you in accurate and specific particle counting.
Sources:


