Entering sample data for fermentation wine measurements
After the images have been recorded, further information for analysis can be entered.
- In the “Sample” field, enter a name for the sample.
- Under “Dilution in Parts” you can enter any dilutions used. These will then be used in determining concentration. Therefore, it is important that the information entered here matches the dilutions performed. For the samples stained with methylene violet or methylene blue, you must also enter the sample’s mix ratio of coloring agent (in parts), as this must also be considered when determining concentration. If only the concentration measurement is performed, these fields will not be displayed. To get the dilution as previously shown in Diluting the sample, you would have to enter 1 part sample and 99 parts water. 0 parts water means that the sample was not diluted before staining.
- The must weight should be stated under Sugar content.
The unit can be changed in the App Settings before starting a new fermentation or measurement.
The sugar content must be determined beforehand using another device (e.g. refractometer / Oscillating U-tube). This value can be entered in the Oculyze system and is included in the forecast through the FW Consultant function. - The previously determined fermentation temperature can be noted under Temperature in °C.
- If the measurement is part of a fermentation, the Start date of fermentation is shown.
- Turbidity – data you previously collected, expressed in NTU.
- In the Comment section, you can include additional Comments.
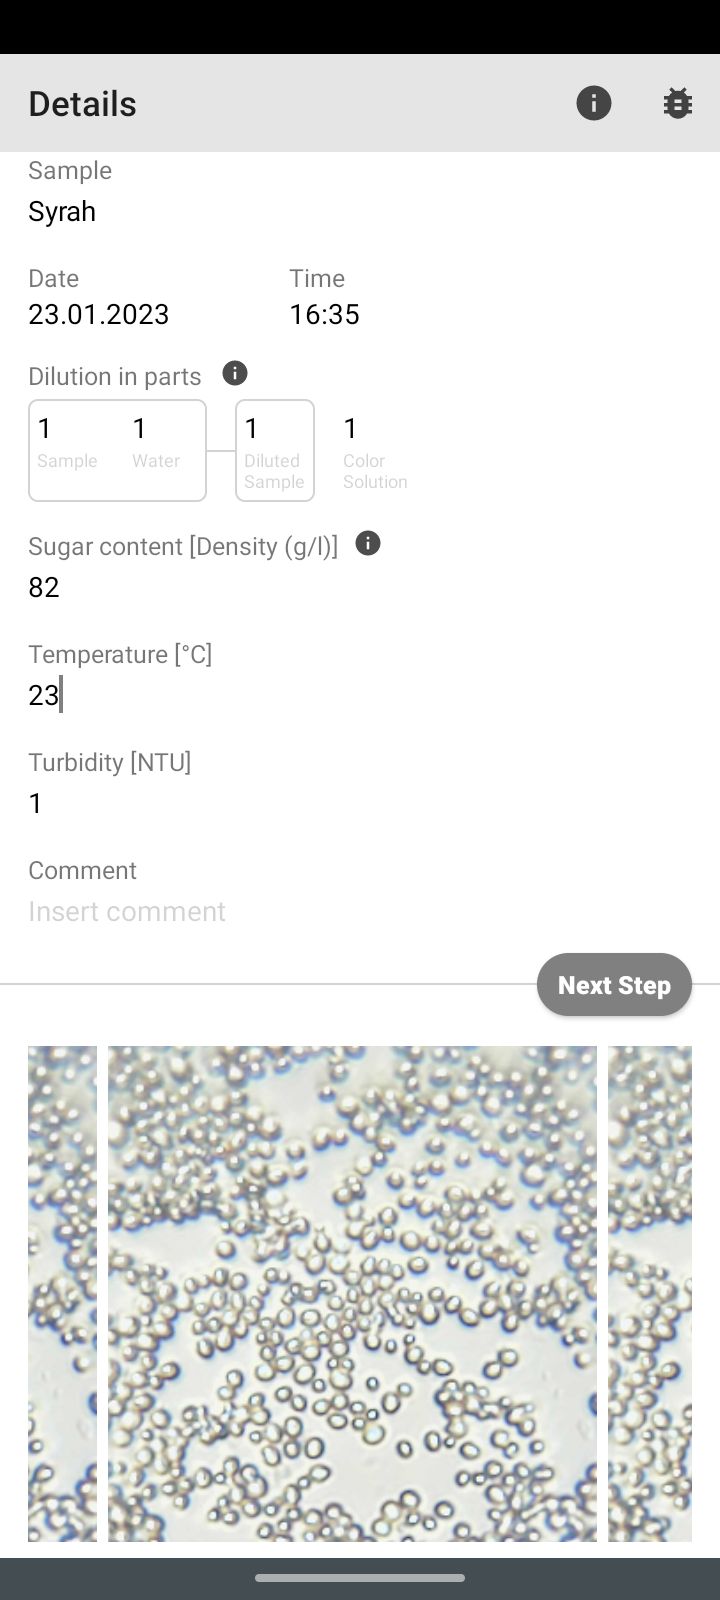
By pressing the “Next Step” button, cloud analysis is initiated.
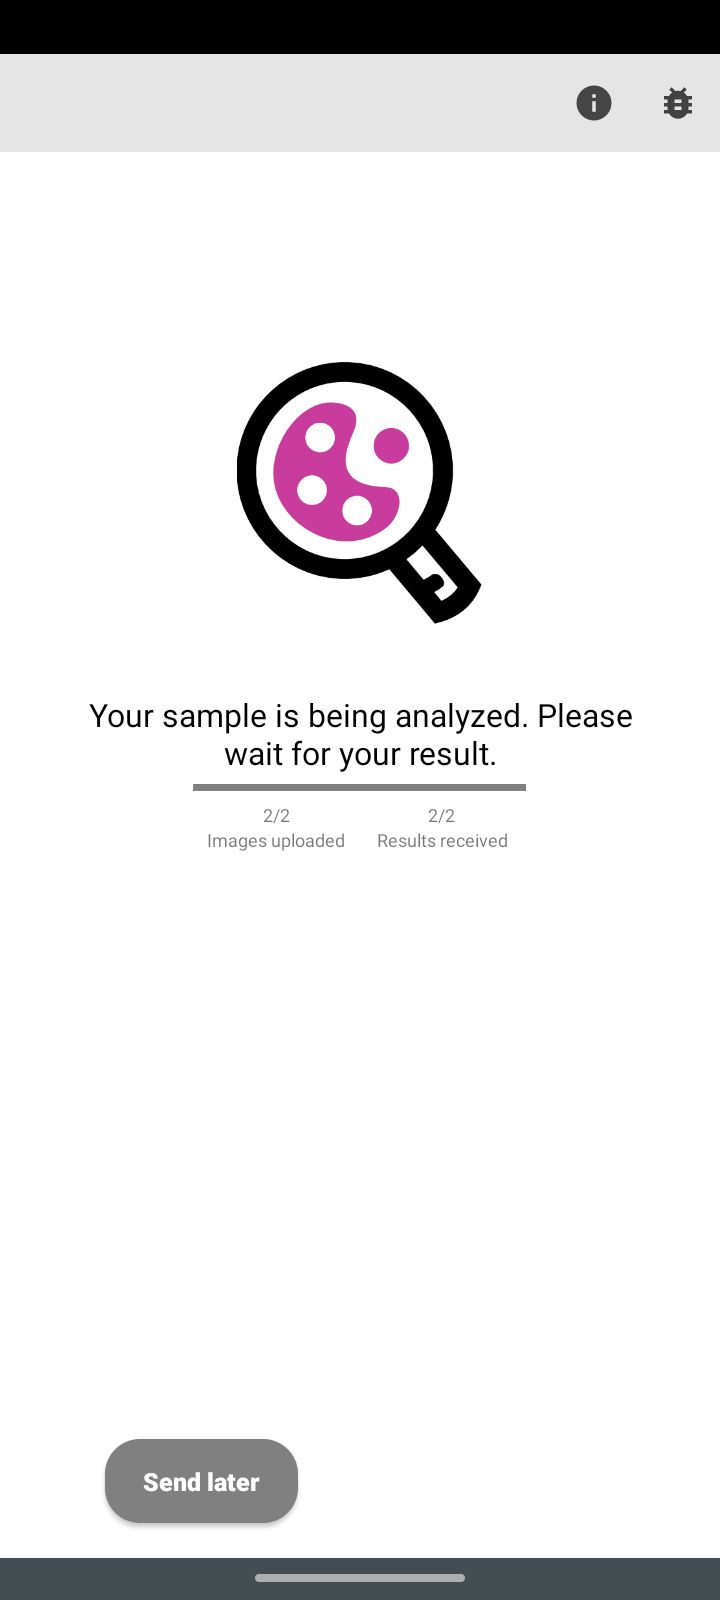
Cloud analysis of data
After entering sample data, the images are sent to the cloud for automatic cell counting and yeast viability analysis. A status screen will appear until the analysis is finished. Depending on the data network, this can take anywhere between a fraction of a second to several minutes. The loading bar shows how many images have been sent to the server and how many have already been analyzed.
Measurements can be saved using the “Send later” button. These will then appear in the History under “Unfinished” and can be uploaded from there for analysis.
The images and the results will be saved in the cloud automatically and can be synchronized with the Web App and Mobile App on any compatible device.
The screen will refresh itself once analysis is done and the results will be displayed.