Entering sample data for Better Brewing measurements
After the images have been recorded, further information for analysis can be entered.
- In the “Sample” field, enter a name for the sample.
- The “+ Tag” button allows you to add tag-label pairs to a measurement. This enables better grouping and browsing of measurements in the History and in the Web App. By clicking the button, two input fields appear – one for the tag and one for the label, which can provide further information about your tag. After both fields have been filled in, the tag label pair is added to your measurement by pressing the “+TAG” button again. Tag-label pairs that have already been added appear on a green background and can be deleted again by pressing the white x. For subsequent measurements a drop-down menu appears after clicking the tag input field. It shows all tag values for selection that have been used in previous measurements. As a suggestion: with the help of the tags, information like the type of yeast used can be added to the measurement by entering for example “yeast” as the tag and the corresponding yeast type as the label.
- Date and time of analysis are filled automatically by the app, when the analysis is started.
- Under “Dilution in Parts” you can enter any dilutions used. These will then be used in determining concentration. Therefore, it is important that the information entered here matches the dilutions performed. For the samples stained with methylene violet or methylene blue, you must also enter the sample’s mix ratio of coloring agent (in parts), as this must also be considered when determining concentration. If only the concentration measurement is performed, these fields will not be displayed. To get the dilution as previously shown in Diluting the sample, you would have to enter 1 part sample and 99 parts water. 0 parts water means that the sample was not diluted before staining.
- In the Comment section, you can include additional Comments.
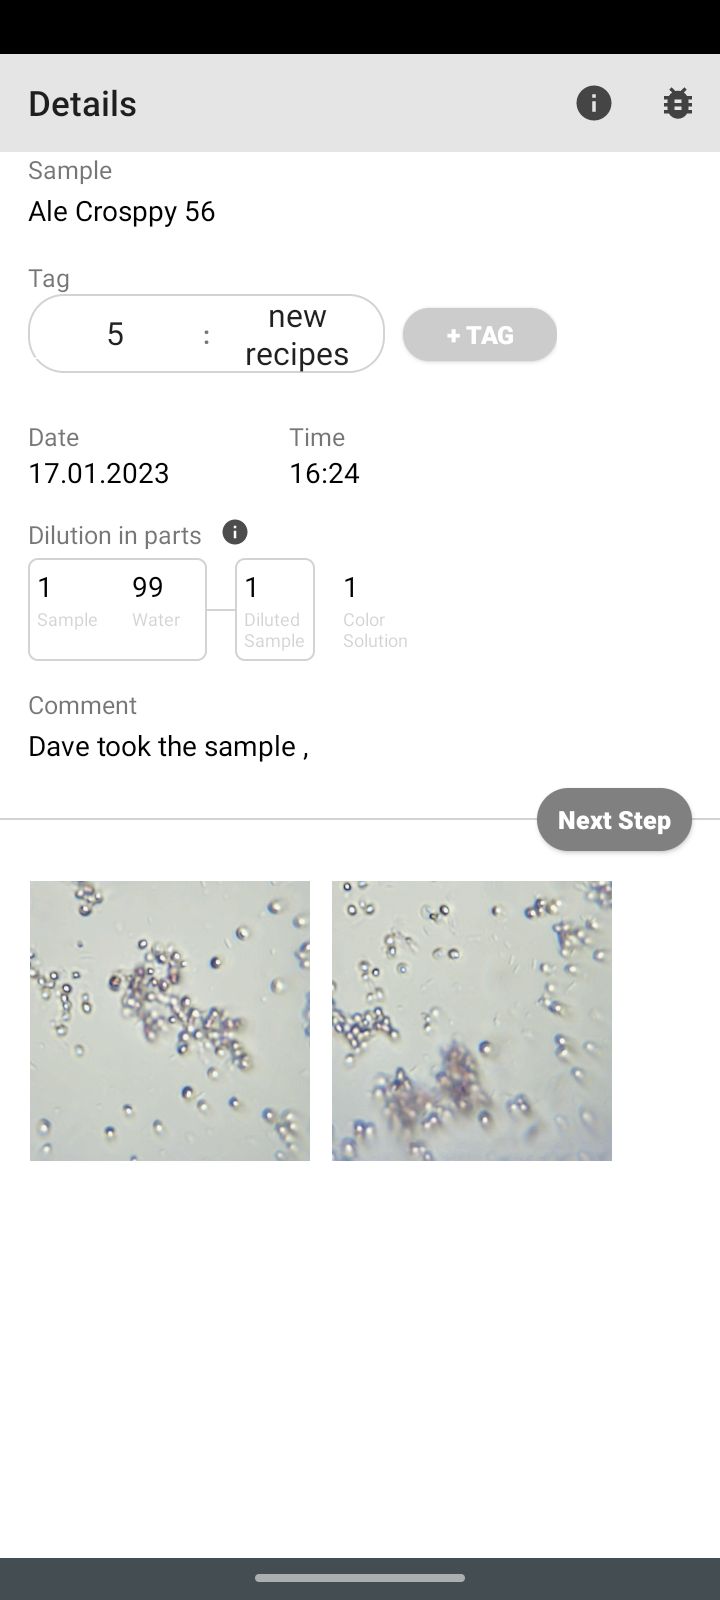
By pressing the “Next Step” button, cloud analysis is initiated.
Cloud analysis of yeast cell counting measurements
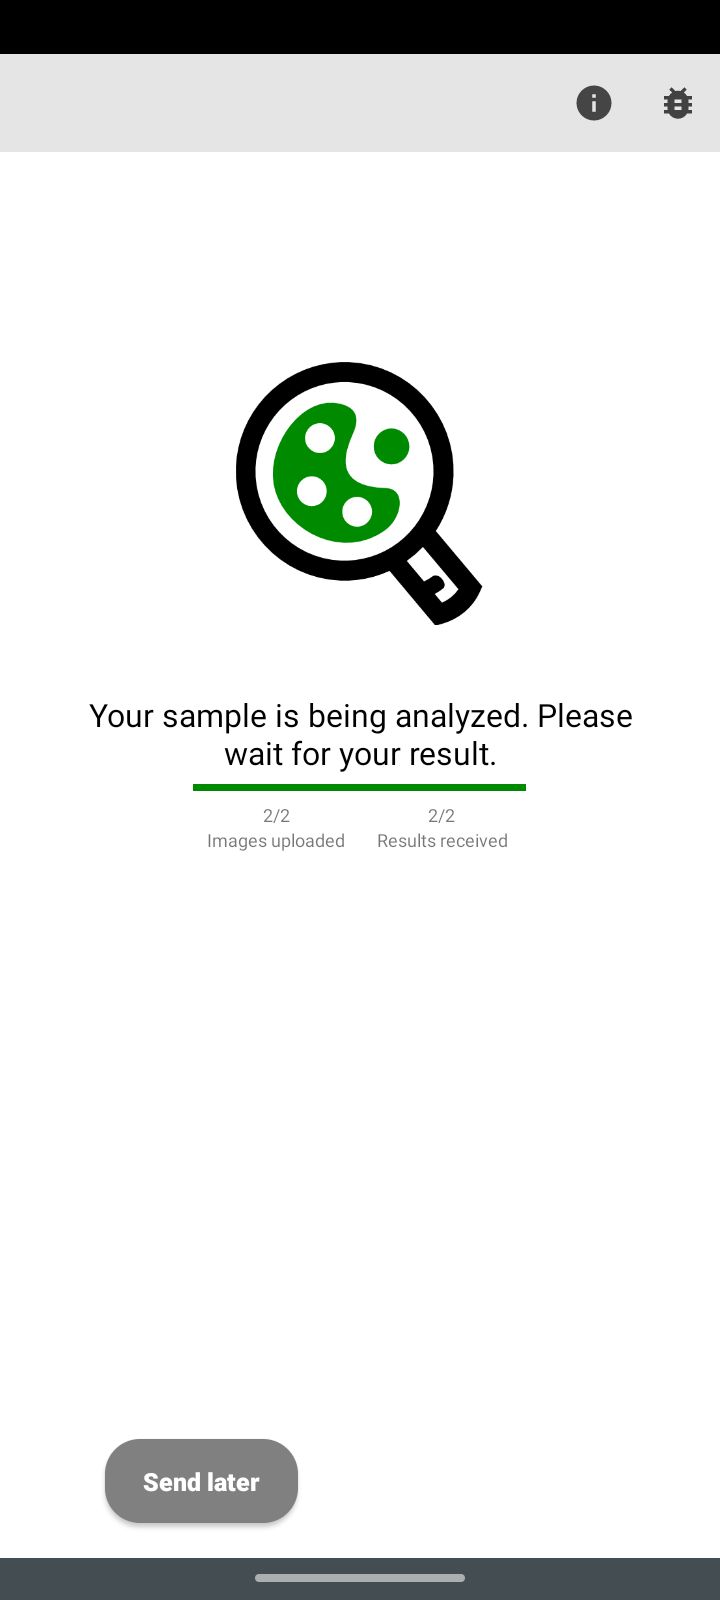
After entering sample data, the images are sent to the cloud for automatic cell counting and yeast viability analysis. A status screen will appear until the analysis is finished. Depending on the data network, this can take anywhere between a fraction of a second to several minutes. The loading bar shows how many images have been sent to the server and how many have already been analyzed.
Measurements can be saved using the “Send later” button. These will then appear in the History under “Unfinished” and can be uploaded from there for analysis.
The images and the results will be saved in the cloud automatically and can be synchronized with the Web App and Mobile App on any compatible device.
The screen will refresh itself once analysis is done and the results will be displayed.