Online Plot Digitizer
It may have never occurred to you to use an online plot digitizer, but it can be enormously helpful across industries. Data visualization is not a new technology. Indeed, it has been in use for decades, and as the world grows increasingly interested in visual information sharing, data plots can be all the more helpful. So, how does this relate to artificial intelligence? And what even is an online plot digitizer?
What Is a Data Plot and Why Do I Need It?
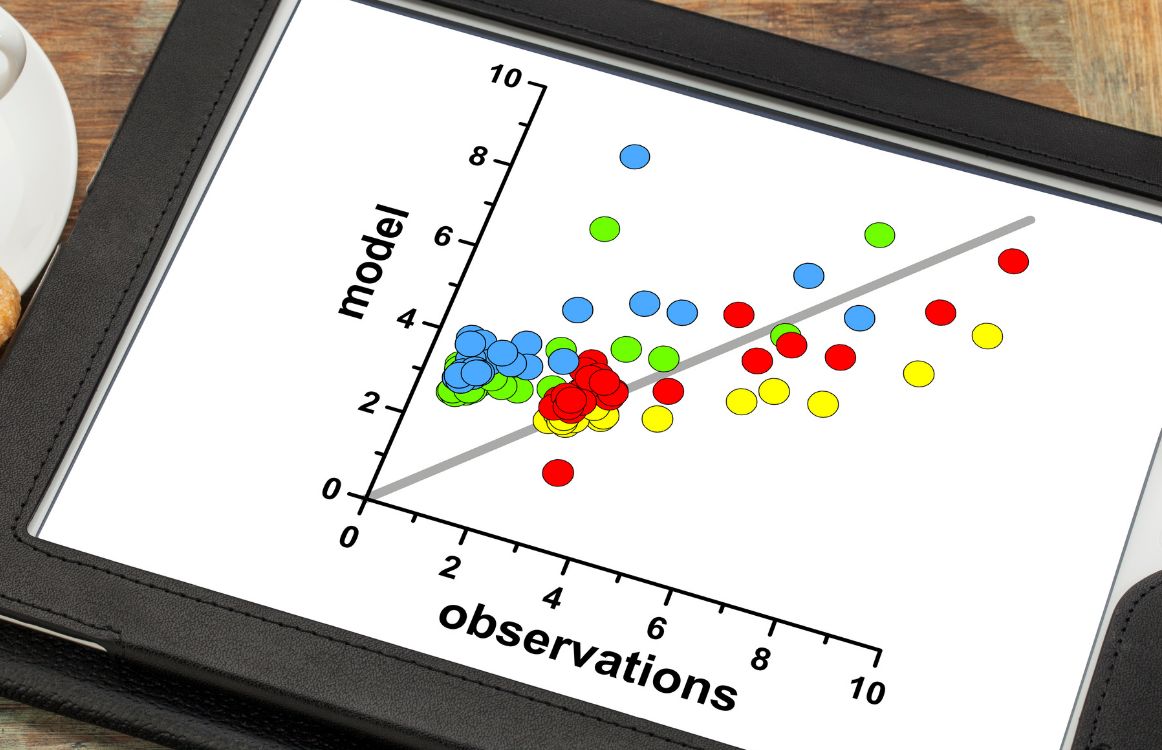
For those in need of a refresher, a data plot is a visual representation of data using data points on a graph.
To create a data plot, you’ll need an X axis and a Y axis, and you’ll need points of data.
One example of this kind of data plot would be to collect data from biotic sources — nature.
We could plot the time of the sunrise each morning.
So, you would make a list of each day you collect this data and what time the sunrises on each day.
Then, to create a graph, you would place your independent variable, the date, on the X axis. Then, place your dependent variable, the times, on the Y axis.
Finally, you plot your data, placing each point exactly (or as close as you can get) where the data would fall on the graph.
This is a basic explanation of a data plot.
You’ll be able to see visually on the data plot how the sun rises earlier each day as the year progresses toward the summer solstice and how the sun rises later each day as the year continues on toward the winter solstice.
Depending on how your graph is created, you’ll see a positive line, a negative line, or an arc, which is called a penumbra, in either direction.
So, why do we create data plots?
Explore
First, we want to explore the information we have on hand, and creating a visual representation of our data allows us to see those positives, negatives, or arcs.
For example, in the manufacture of materials, we want to be able to see how much pressure we can exert on a specific metal, wood, plastic, or glass before it breaks. We need this information for the construction of houses and buildings, for the manufacture of tools, for the creation of machines, and more.
In the production of pharmaceuticals, we might want to know how effective an antibiotic is over a bacterium, which tells drug manufacturers how much antibiotic to include in the drug.
In health and human services, we might want to see how virulent a virus is or how long the virus lasts in the human body on average.
All of this information is collected as data.
Monitor
Then, once we’ve begun to collect data, we often want to monitor the ongoing situation.
For example, back to pharmaceuticals, you might want to monitor whether a drug’s effectiveness wears off over time or whether adverse events occur as time goes by.
In the manufacture of tools, fabrics, and machines, you might want to test the ongoing strength of a particular material.
In the brewing industry, you’ll want to monitor how long you’ve been working with a particular yeast strain and whether its viability seems to be waxing or waning.
Explain
Finally, we use data plots to help explain what we see to others.
In a classroom or in a boardroom, you’ll want to provide visual aids to your audience, so they can better integrate the information you give them as you deliver it.
Data plots help give you something to point to when you deliver the news, bad or good, and give your audience something concrete to point to in terms of what is working and what is not.
In a brainstorming session to fix issues, data plots help keep the conversation grounded in the data.
What Industries Use Data Plots?
As we’ve seen above, data plots can be used across virtually all industries and can be helpful for various uses.
What Is an Online Plot Digitizer?
Now, you’re probably already familiar with plotting data on a computer and having the computer create a data plot for you, whether it is a bar graph, a line graph, or some other type of visual aid.
What a plot digitizer does is reverse engineer than information.
Why would you need to do this?
Let’s say you’ve received a data plot from a client that shows the performance of a competitor, and you need to know what the actual data says. An online plot digitizer will take the image of the plotted data and provide you with the actual data.
This application will also come in handy if you are testing a new drug or verifying information given to you by a colleague.
If you have any questions as to what the data behind the plot says, an online plot digitizer will help you.
Oculyze Can Help
Oculyze has designed an online plot digitizer that uses artificial intelligence to reverse engineer any data plot or graph you have an image of.
If you can upload the image to the application, the online plot digitizer can provide you with the hard data that plot is based on.
This information becomes power when discussing the data plot as you’re working now with the hard numbers behind the visual aid.
When it comes to discussions of manufacturing, of health and human services, of healthcare, of biotic changes, or any other type of science, technology, or engineering, it always pays to have as much information as possible.
This information provides us with pathways forward and better tools to figure out what those pathways might be.
To that end, an online plot digitizer can only help.
Here is an example of how the digitization with the Oculyze Plot Recognizer works*:
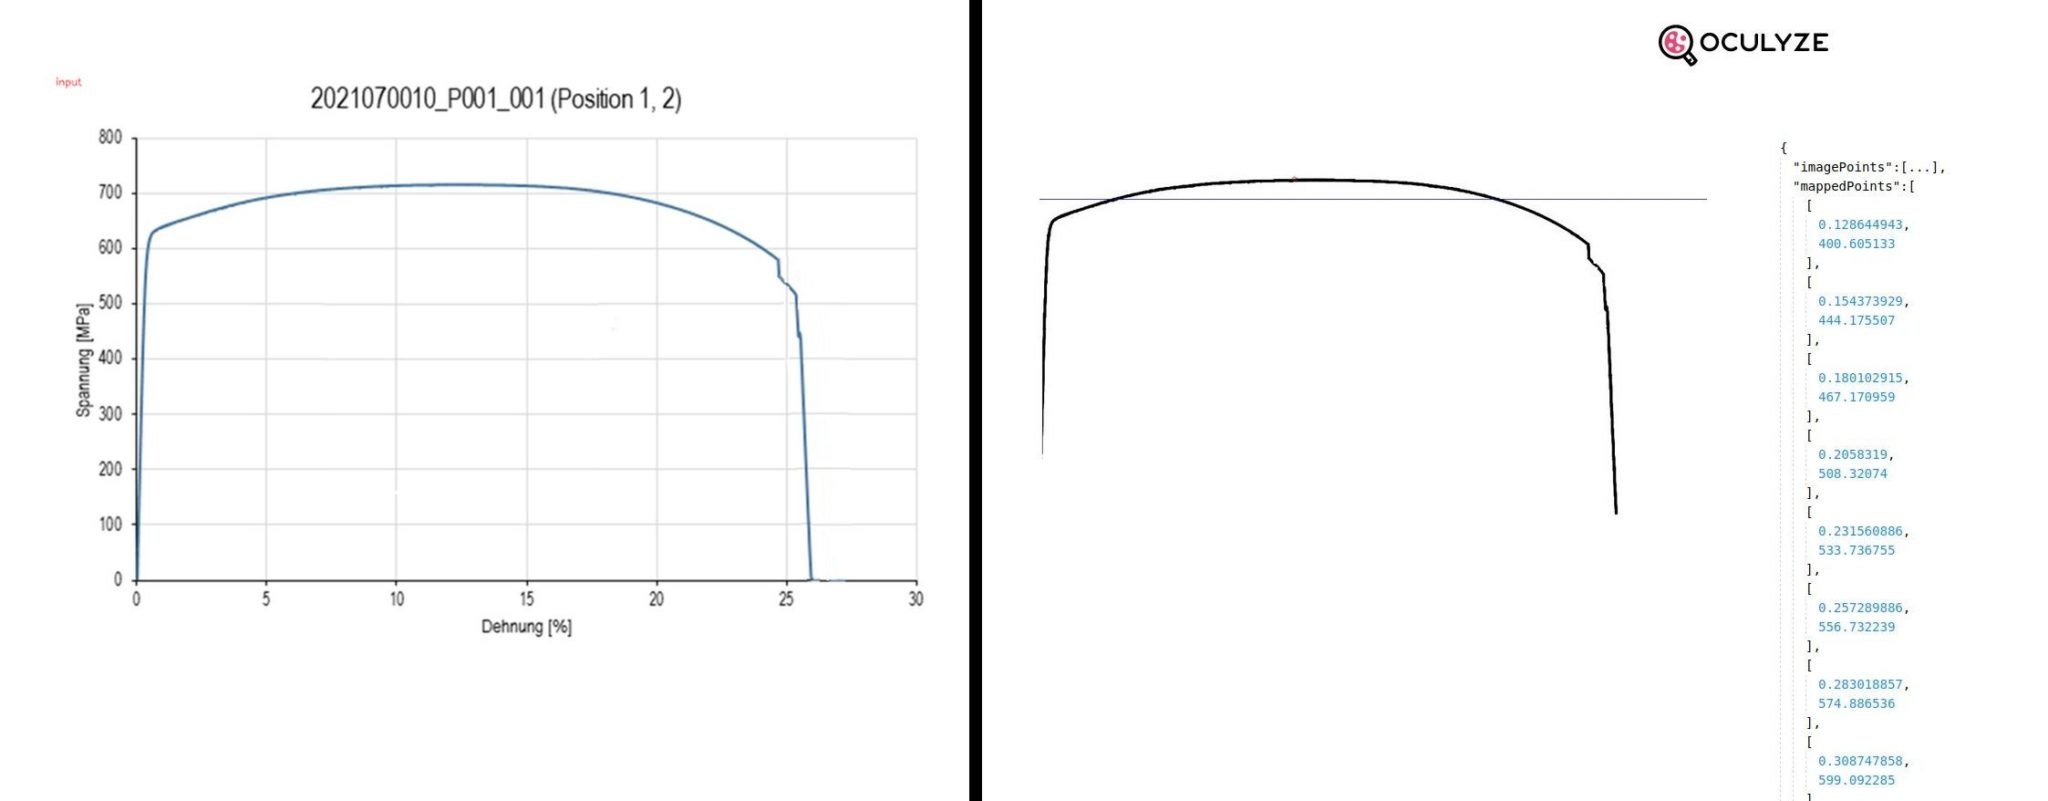
*The mapped Points are the x-y coordinates matched to the scale of both axis. The imagePoints data are the same points but in pixel coordinates of the output image, thus not yet mapped to the axis scale.
The Oculyze Plot Digitzer Online App can further be developed to work for a variety of charts, beyond the XY, so if you’re interested in a specific use case, contact us at [email protected]! Also, you can now test our plot digitizer online app for free.


