Custom Solution (IAP) > Use Cases > Plot digitization
Plot digitizer: online tool for engineers and researchers
Plots are visual representations of data sets illustrating the relationship between variables. They are widely used in academia, but also in numerous other domains having to do with technology, finance, or engineering, as they can easily convey understanding, more so than having mere lists of values.
But what happens when you have a series of plots that are of interest to your work and no way of accessing the data set behind them? You basically need to reverse engineer the images to extract the underlying data.
Oculyze has developed an App for digitizing plots, which does exactly that: it can extract data from a graph and map the exact values of that curve to the X-Y values.
Let’s take the steel industry as a use case.
In the steel industry, but also in materials science and engineering, plots have been widely used in studies on material behavior. A stress-strain curve, for instance, illustrates the relationship between stress and strain (stress being the measure of the force that a material is experiencing per cross-sectional area, while strain refers to the deformation of the material) and it is one of the most reliable tools for evaluating the mechanical properties of a material. A stress-strain curve can provide information about a material’s stiffness, strength, ductility and so much more.
Consequently, there is an enormous amount of decades’ worth of data out there stored in graphs that are invaluable to engineers and other professionals in the steel industry.
The Oculyze Plot Digitizer Online App can digitize all that data in a matter of seconds, allowing the user to store a digital representation of the curve, along with the extracted values. All that’s needed is the image of the plot and (for now) the X and Y values of the graph.
You can take any scanned image of a plot and almost instantly digitize the values of the plot. The data will be saved in a YAML file that you can then easily access and use.
Here is an example of how the digitization with the Oculyze Plot Recognizer works*:
Input: Output:
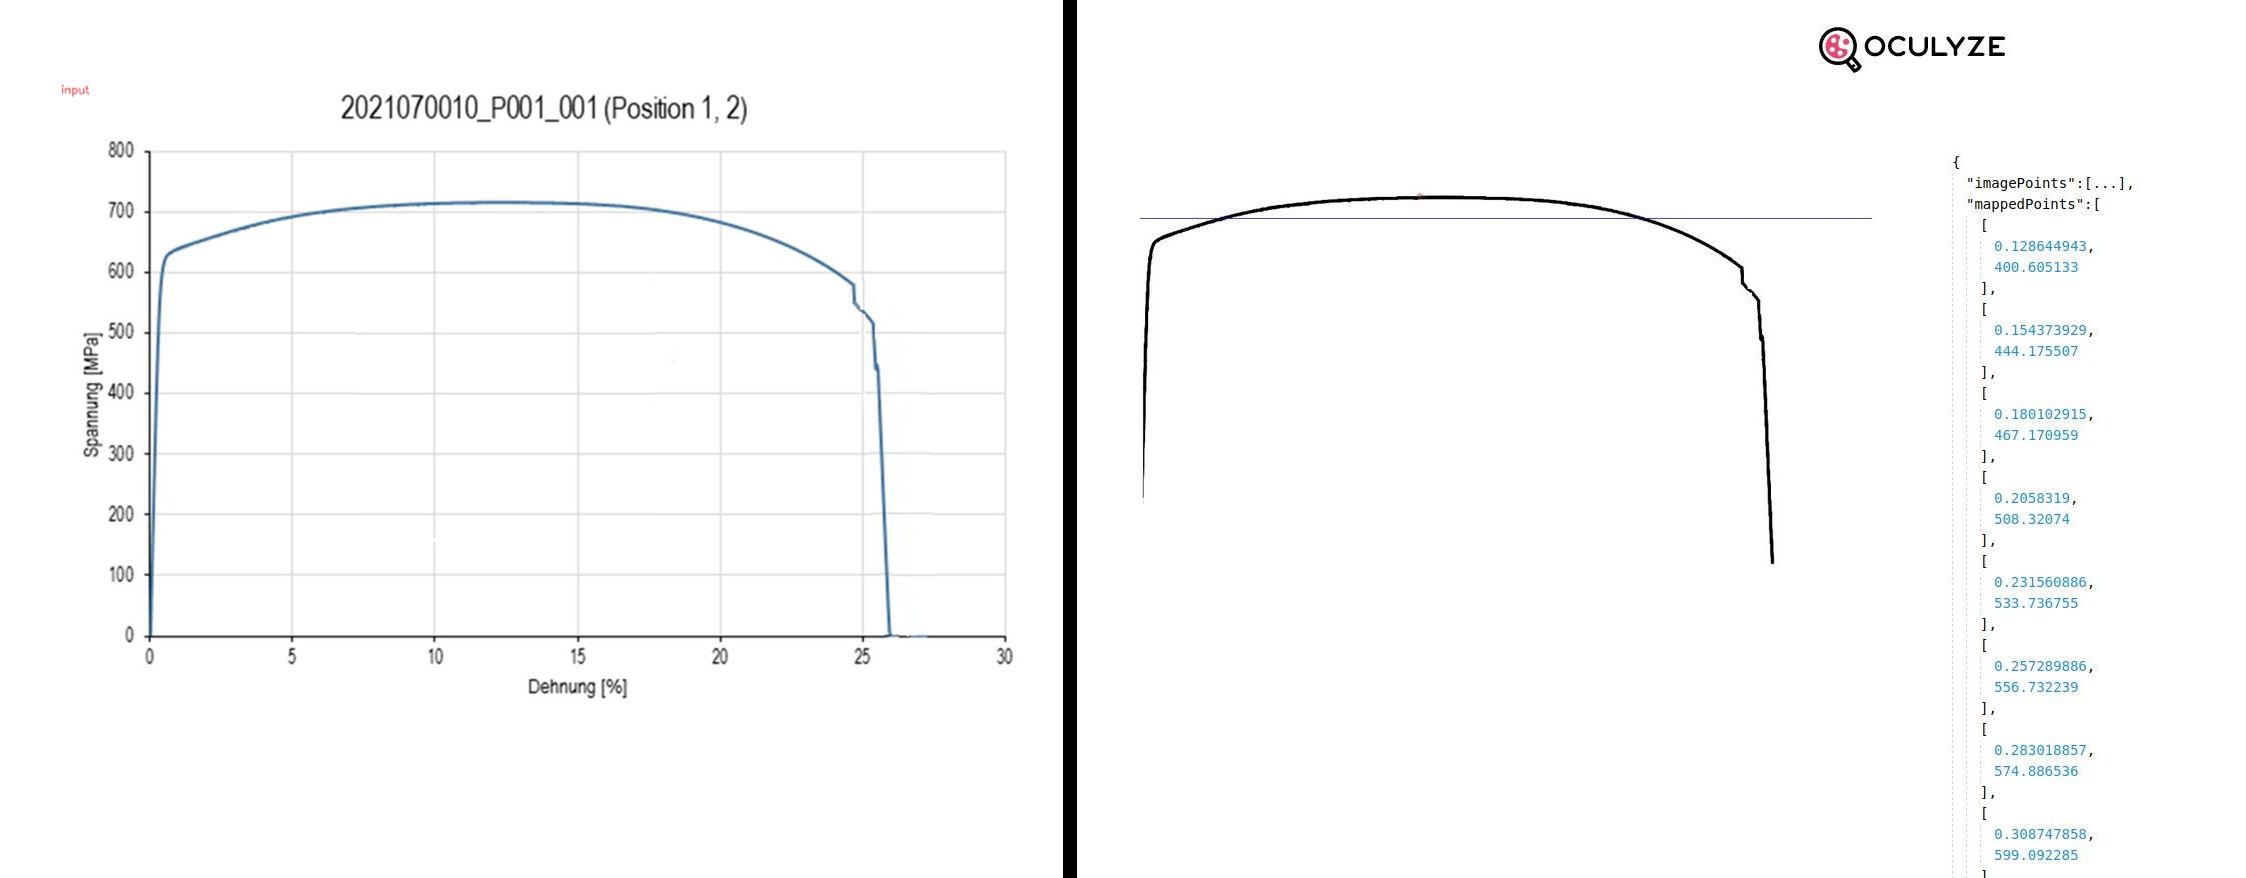
*The mapped Points are the x-y coordinates matched to the scale of both axis. The imagePoints data are the same points but in pixel coordinates of the output image, thus not yet mapped to the axis scale.
The Oculyze Plot Digitzer Online App can further be developed to work for a variety of charts, beyond the XY, so if you’re interested in a specific use case, contact us at [email protected]! Also, you can now test our plot digitizer online app for free.