Main Page of the better brewing app
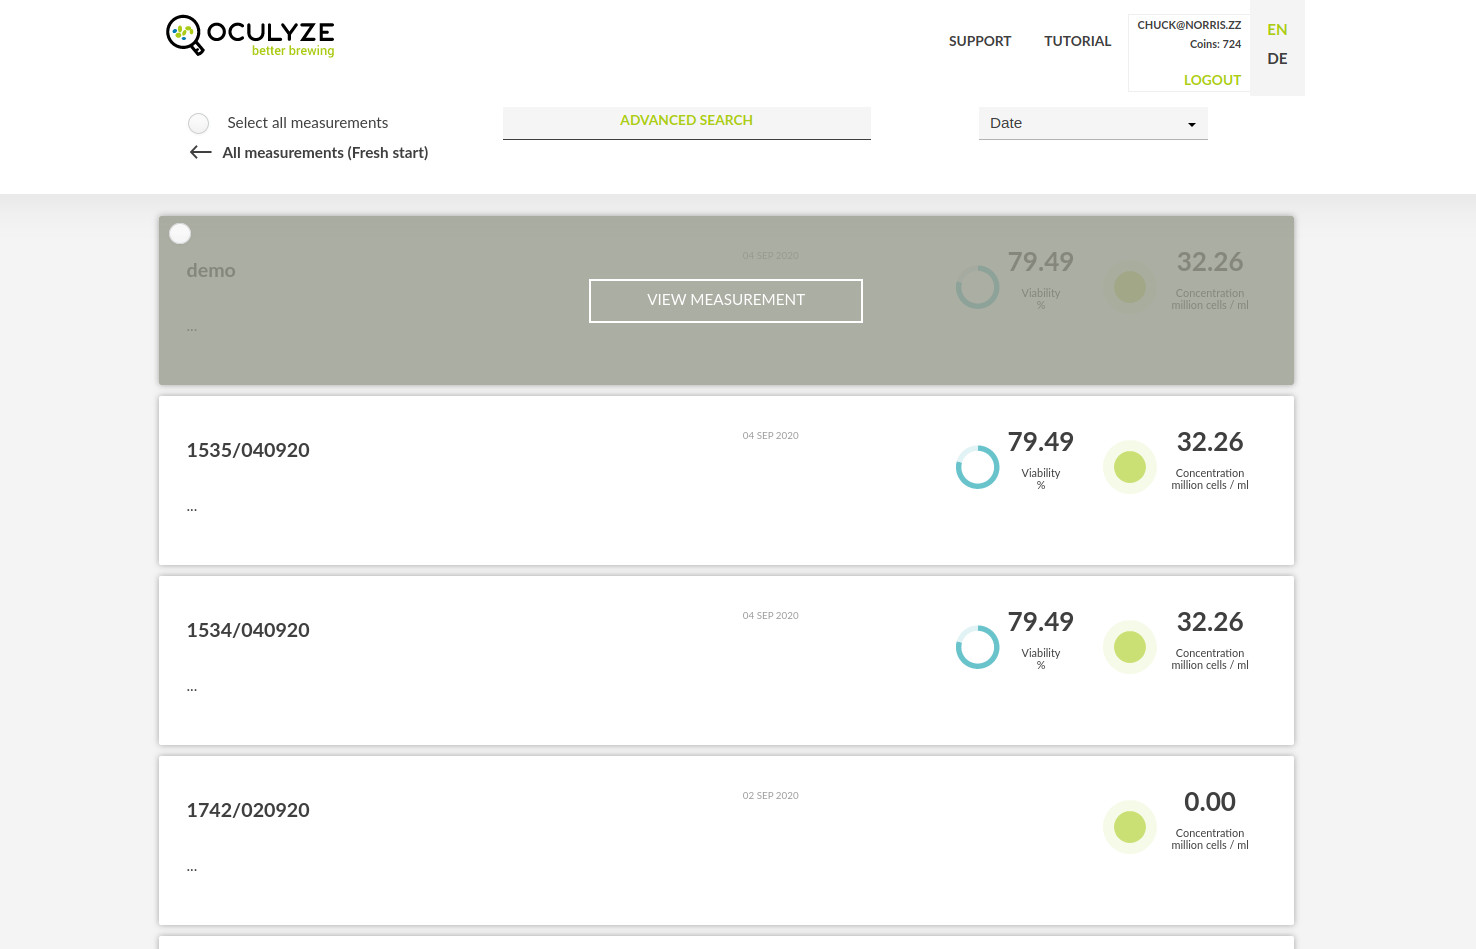
After a successful login, the main page opens, listing all completed measurements.
Each measurement is displayed as a list entry with Name, Date, Viability and Concentration. The selection of measurements is possible via the button in the top left corner of the list entry.
Further details of the measurements can be accessed by clicking it.
The head section gives you access to the following functions:
- Support – Opens a window to send us a message.
- Tutorial – Currently under construction
- Block with Username, License details and a button for Logout – The license details under “Coins” show how many measurements are still possible and under “Expires” when the license becomes invalid. If you have purchased individual measurements, the information under “Coins” applies. For flat rate customers the information under “Expires” applies. Use the “Logout” button to log your user out and return to the Login Page.
- Buttons to switch between English and German language
- Selector for all measurements – Allows you to select and deselect all measurements.
- Arrow – Clears all filter results and existing selections.
- Advanced search – Allows you to filter measurements by Min and Max Viability, Min and Max Concentration, Date, Tags, Name or Comment.
Using the “Tags” field allows you to filter by tag-label pairs. A free text search is carried out in both fields.
Advanced search and Auto-sort function are only accessible if no measurement is selected.
- Auto-sort function to sort by Sample name, Date, Viability or Concentration
After the selection of measurements, the following functionalities appear:
- Export function – Generates a zip file for all selected measurements including recorded images, result images and CSV file with all raw data of the individual measurements.
- Report function – Creates a PDF including all data selected in the appearing pop-up.
- Average function – Calculates the average for Concentration and Viability of all selected measurements
- Timeline function – Generates a graph plotting the concentration and viability of the selected measurements over time.
When clicking on a single measurement, a new page opens to view the details.