Individual fermentations in the fermentation wine web app
All data of a fermentation and the associated individual measurements are summarized on this page. It can be accessed via the respective overview of Ongoing and Completed Fermentations.
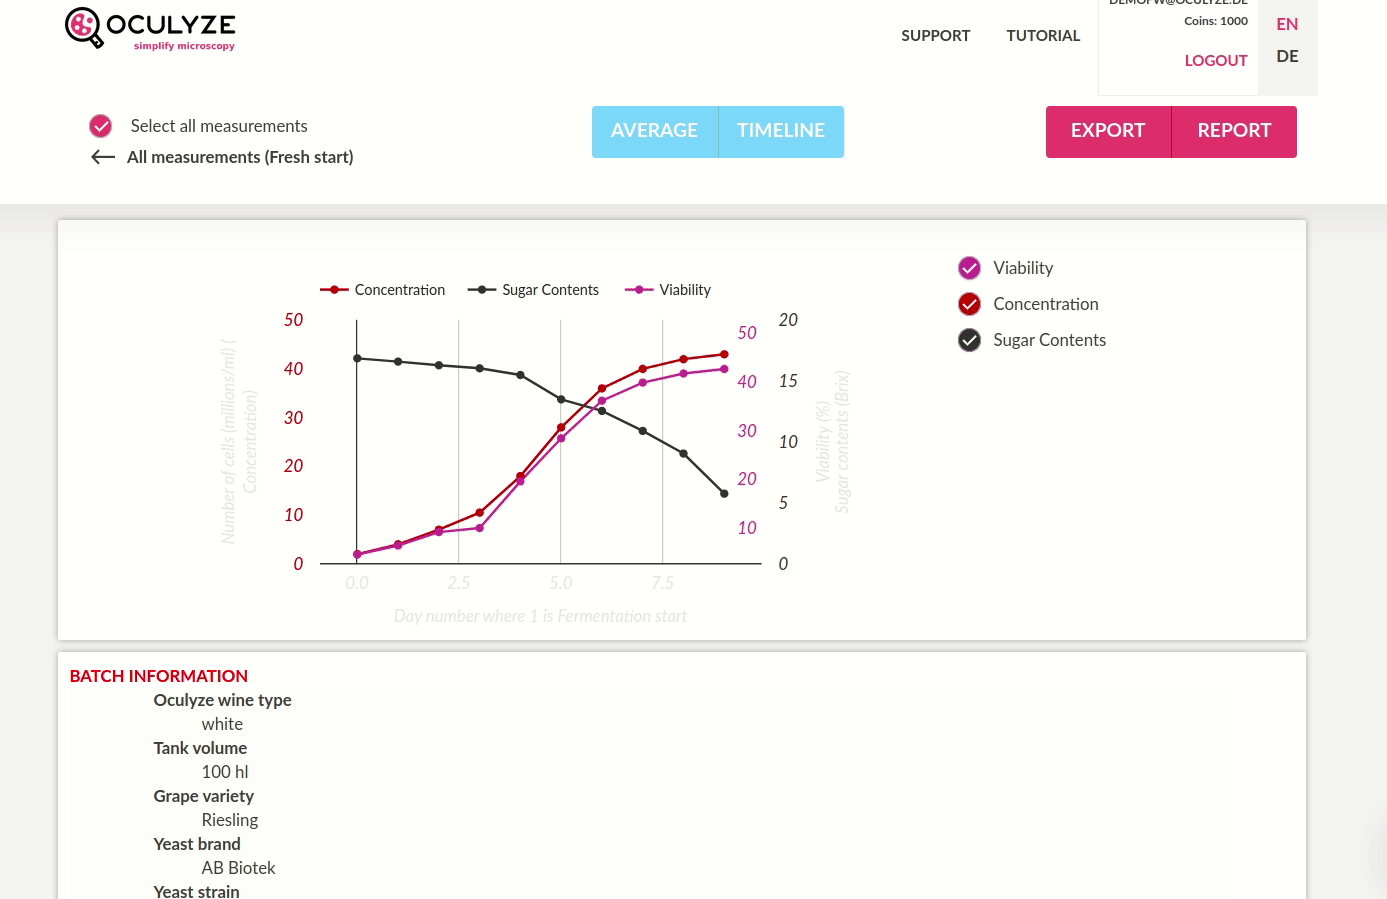
The page includes:
- Summary graphs of all selected individual measurements for:
- Concentration (red graph) in million cells / ml (axis on the left)
- Viability (violet graph) in million cells / ml (axis on the left)
- Sugar content (black graph) in selected unit (axis on the right)
- Fermentation Details that were specified when the fermentation was created
- List of the individual measurements including name, date, viability and concentration that allows to select individual measurements for the integration in the graph. This is possible via the pink button in the top left corner of the list entry. Measurements that have not been selected are not shown in the graph. Further details of individual measurements can be accessed by clicking the list entry or the individual values in the graph.
In addition to the functions already explained for the Main Page, further functions are accessible in the header:
- Selector for all measurements – Allows you to select and deselect all measurements.
- Navigation arrow – The arrow takes you back to the Main Page
- Advanced search – Allows you to filter measurements by Min and Max Viability, Min and Max Concentration, Date, Name or Comment.
Advanced search and Auto-sort function are only accessible if no measurement is selected.
- Auto-sort function to sort by Name, Date, Viability or Concentration
- Export function – Generates a zip file for all selected measurements including recorded images, result images, SVG file of the graph, CSV file with all raw data of the individual measurements.
- Report function – Creates a PDF including all data selected in the appearing pop-up for all selected individual measurements.